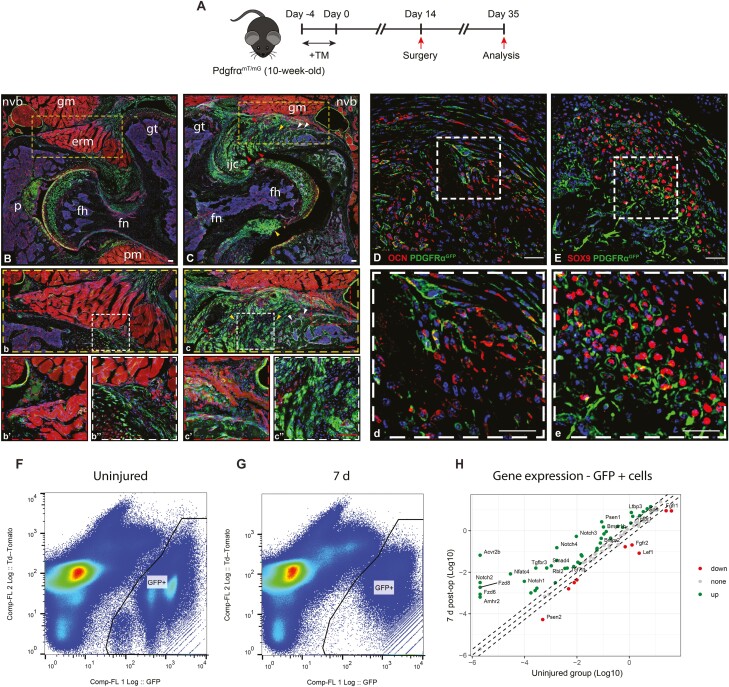
Figure 6.
PDGFRα expressing cells give rise to the heterotopic bone after acetabular reaming. (A) PDGFRαmT/mG reporter animals underwent induction of heterotopic ossification (HO) by acetabular reaming, followed by analysis at 3 weeks post-operatively. Tamoxifen labeling was performed 14 d prior to surgery. PDGFRα+ cells and their progeny appear green, while all other cells appear red. (B) Axial section is taken from an uninjured hip. erm: extrarotators muscles; fh: femoral head; fn: femoral neck; gm: gluteus medius muscle; gt: greater trochanter; nvb: neurovascular bundle; p: pulvinar. (b-b’’) high magnification pictures showing more in detail the normal structure near the neurovascular bundle (b’) and the tissue interposed between the acetabular bone and the extrarotator muscle complex. (C) Axial section obtained 3 weeks after HO induction, demonstrating the newly formed heterotopic bone (white arrowheads) in the periacetabular area in proximity to the neurovascular structures (C-c’), including chondroid (yellow arrowheads) (C, c’’) and fibroproliferative (red arrowheads) areas. Co-staining with OCN (D-d) and SOX 9 (E-e) confirmed the osteochondral commitment of PDGFR-alpha expressing cells. DAPI nuclear counterstain appears blue. (F) Flow cytometry plots of microdissected peri-acetabular tissues among uninjured and (G) 7 d post-injury PDGFRαmT/mG reporter animals. Td tomato positive cells are shown on the left and GFP expressing cells are shown on the right of the plots. (H) Gene expression in Log 10 among injured and control PDGFRα-mGFP+ cells. Each dot represents one gene with green ones representing 2-fold higher expressed in 7 d group and red ones represent 2-fold lower expressed genes after injury. The gray dots represent genes within 2-fold cutoff threshold. The dashed lines represent −2, 0, and +2 fold change, respectively. N = 8 animals used, 3 for 7 d and 5 for the uninjured group. Red scale bars: 100 μm, white scale bars: 20 μm.

