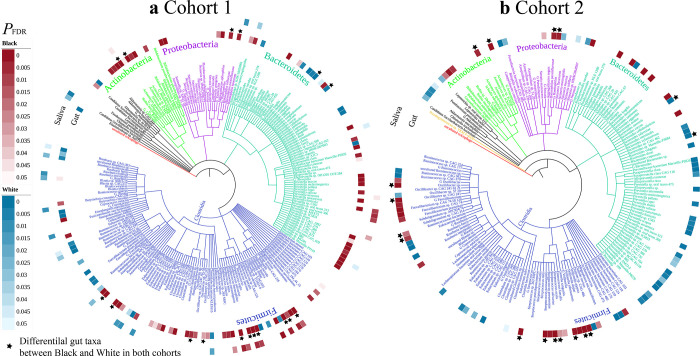
Fig 4. Ethnicity-associated variation in abundant microbial taxa and phage.
The 219 taxa in cohort 1 (A) and 182 taxa in cohort 2 (B) included in the phylogeny are present in all participants and have relative abundances of >1% in at least one of the gut or oral microbial metagenomes. The inner circle indicates differential taxa in the gut between the 2 ethnicities; the outer circle indicates differential taxa in the saliva between the 2 ethnicities. Pink or blue color gradients indicate FDR-adjusted p-value of significance (LinDA function in MicrobiomeStat package fitting linear mixed-effects models ‘~ Ethnicity + Antibiotic Use + Hormonal Contraceptive + (1|Day)’) for centered log-ratio transformed abundance between the 2 ethnicities. Data underlying this figure can be found at S1 Data. Pink indicates more abundant in Black participants, and blue indicates more abundant in White participants. Star indicates differential abundant taxa in the gut between the 2 ethnicities in both cohorts. Taxon name with a “G” before the name indicates the taxon was classified at the genus level.

