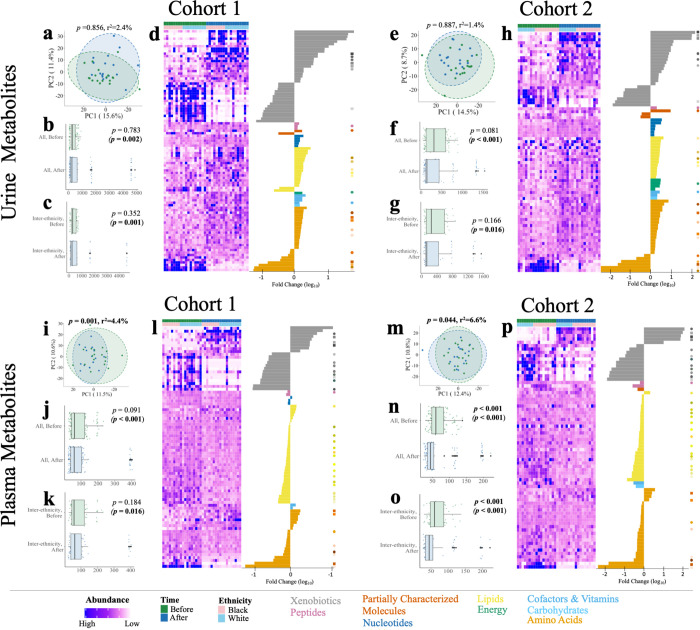
Fig 5. Dietary intervention alters urine and plasma metabolomes.
Univariate analysis on metabolomic samples before and after a short-term diet identified 180 significantly changed total metabolites in cohort 1 and 152 metabolites in cohort 2 (PFDR < 0.05, Wilcoxon signed-rank test). Total urine metabolome compositions were not significantly different between diet stages or ethnicities in either cohort (A, E) (PFDR < 0.05, PERMANOVA). In cohort 1, 97/842 urine metabolites (D) significantly changed over the diet period, while in cohort 2, 80/835 urine metabolites (H) significantly changed. Total plasma metabolome compositions were significantly different between diet phases (I, M) in both years (PFDR < 0.05, PERMANOVA). In cohort 1, 83/796 plasma metabolites (L) significantly changed between diet phases, while in cohort 2, 72/736 plasma metabolites (P) were significantly different. Pairwise Euclidean distance between all participants and interethnic groups significantly changed in urine (B, C, F, G) and plasma (J, K, N, O) across cohorts (P < 0.05, Wilcoxon rank-sum test). Statistics in parentheses denote the removal of outlier participants (see Materials and methods, Metabolomics analysis). Individual scaled abundances are shown above by stage and by ethnicity and ordered by super pathway. Heatmaps reflect all significantly changed metabolites within cohort-matched, color-coded dots and ordered by decreasing log 10-fold change within each super pathway. Circles denote metabolites significant in both cohorts; squares represent metabolites significantly different in both cohorts and in both urine and plasma. Abundance corresponds to scaled and transformed intensity value of each metabolite. A key of ordered metabolites, fold changes, and p-values can be found in S1 Data.

