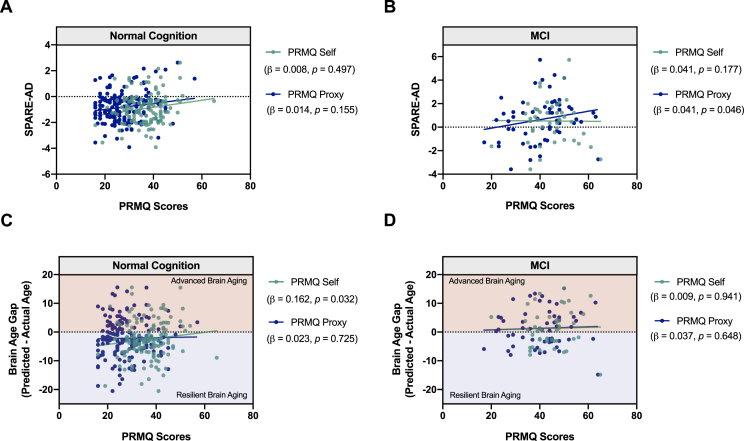
Fig. 4.
Relationship between SMCs and patterns of brain atrophy associated with AD and aging. Scatter plots shows the relationships between SPARE-AD index and self- and partner-reported SMCs (PRMQ Self and Proxy Scores) in (A) NC participants and (B) MCI participants. Greater partner-reported SMCs were associated with more pronounced AD-related atrophy. In MCI. C, D) Predicted Age of a subject can be ascertained based on the degree of brain atrophy in areas associated with aging (SPARE-BA index; see Methods). The Brain Age Gap for each subject was calculated by predicted— chronologic age, whereby positive values indicate advanced brain aging (shaded red), and negative values indicate resilient brain aging (shaded blue). Linear regressions were performed to evaluate the relationship between the Brain Age Gap and SMCs in NC and MCI participants after controlling for chronologic age, sex, race, and education. Scatter plots represent the relationship between the Brain Age Gap and self- and partner-reported SMCs (PRMQ Self and Proxy Scores) in (C) NC and (D) MCI participants. Greater self-reported SMCs were associated with more pronounced age-related atrophy in NC.

