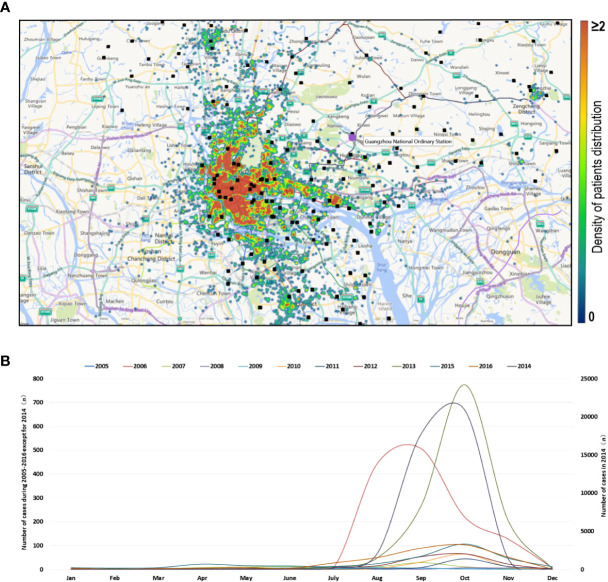
Figure 1.
Temporal and spatial distribution characteristics of dengue cases from 2005 to 2016. (A) Accumulative spatial distribution of dengue cases from 2005 to 2016 in Guangzhou. Each patient with dengue fever reported from 2005 to 2016 represents a point, and all of the points are represented on the map. Black dots represent weather stations providing weather data. (B) Time distribution of dengue cases from 2005 to 2016. The left ordinate shows the case numbers of dengue for all years except 2014, and the right ordinate shows the case numbers of dengue in 2014.

