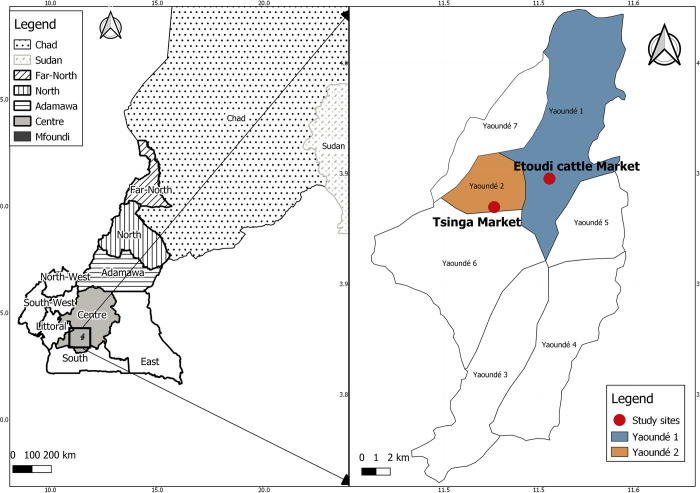
Fig 1. Geographic repartition of the animal used for the study.
Panel A represents the locations and origins of the animals. The northern region where animals originated from Cameroon is represented by the black stripes, oblic stripes represent the Far-North, vertical, the North, and horizontal stripes the Adamawa region. Neighboring countries are represented by black dots (Chad) and dash grey (Sudan). Light grey represents the Centre region with the Mfoundi division in dark grey. Panel B presents the markets from where the cattle (in dark blue) and the small ruminants (in orange) have been sampled. QGIS version 3.14.16, was used to generate the map using open access sharefiles (https://gadm.org/)

