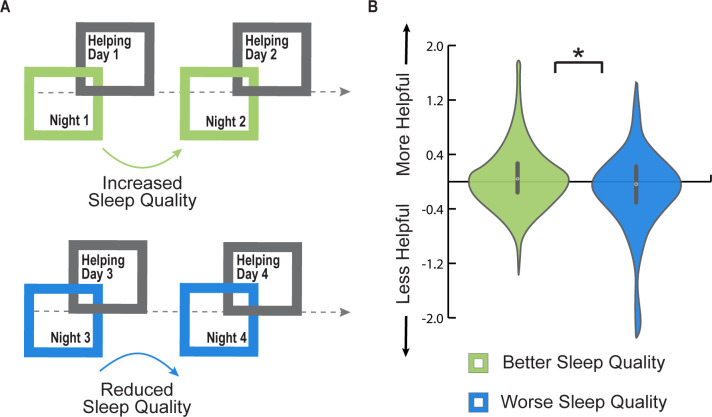
Fig 2. Micro-longitudinal Study 2.
(A) Study design. Participants were asked to complete daily sleep logs and helping behavior questionnaires across 4 days, allowing for the assessment of free living, natural variations in both sleep, and helping choices across the micro-longitudinal assessment period. (B) Reduced sleep quality from 1 night to the next was associated with a significant decrease in helping choices from 1 corresponding day to the next and vice versa (β = 0.02 ± 0.01, P < 0.05, see Results for the full model). Violin plots depict the change in next-day helping behavior between the maximal and minimal sleep quality nights for each participant across the study period. *P < 0.05. Individual data presented in this figure can be found in S2 Data.

