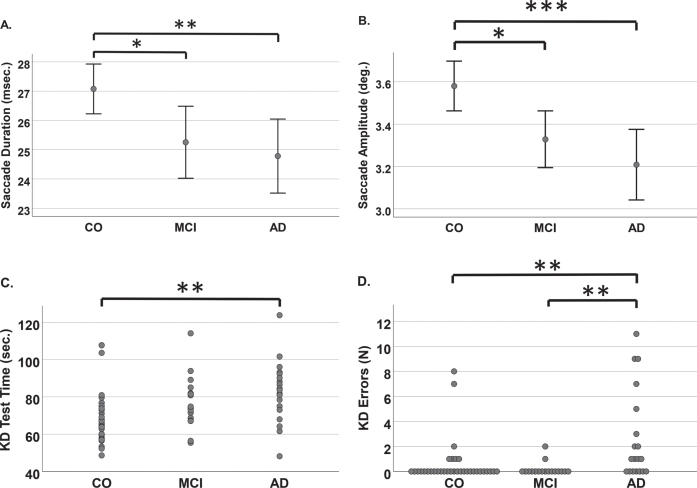
Fig. 2.
The total time, saccade duration and amplitude during the King-Devick (KD) test were calculated from eye-tracker recordings. Number of errors were calculated from the audio recordings. Saccade data are shown as means with 95% confidence intervals. A) The mean duration and B) the mean amplitude of saccades were both significantly decreased in the mild cognitive impairment (MCI) and Alzheimer’s disease (AD) groups compared to the control group. C) Scatter plot of the King-Devick (KD) test time (as total time used in seconds). On average, the MCI group was slower than control group, and the AD group was the slowest. D) Stacking scatter plot of the number of errors made during the KD test. In the AD group, more than half of the participants made errors, whereas other groups were mostly error-free. Outliers in the control group read some part of the test out of order. One MCI participant read the last slide of the KD test out of order, making more than 30 errors, and was removed from analysis. * p≤0.05, **p≤0.01, ***p≤0.001.

