. 2021 Dec 1;31(2):342–351. doi: 10.1158/1055-9965.EPI-21-0555

Figure 2.

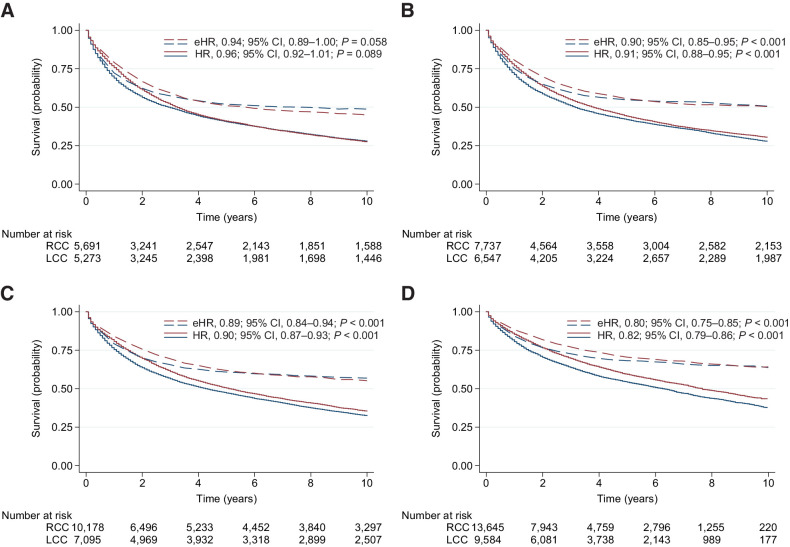
Figure 2. Survival estimates for all patients stratified by four 10-year periods. Estimates of OS (solid line) and RS (dotted line) are presented for RCC (blue) versus LCC (red) in patients diagnosed during 1977–1986 (A), 1987–1996 (B), 1997–2006 (C), and 2007–2016 (D). HRs and eHRs are unadjusted, comparing LCC with RCC (reference). Numbers at risk are for OS estimates.

Survival estimates for all patients stratified by four 10-year periods. Estimates of OS (solid line) and RS (dotted line) are presented for RCC (blue) versus LCC (red) in patients diagnosed during 1977–1986 (A), 1987–1996 (B), 1997–2006 (C), and 2007–2016 (D). HRs and eHRs are unadjusted, comparing LCC with RCC (reference). Numbers at risk are for OS estimates.