. 2021 Dec 1;31(2):342–351. doi: 10.1158/1055-9965.EPI-21-0555

Figure 5.

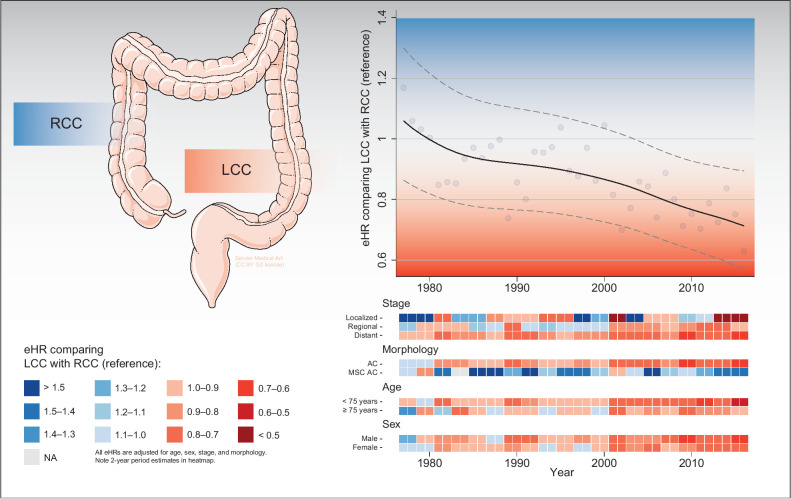
Figure 5. Graphical abstract summarizing main survival trends comparing LCC with RCC (reference). Top right, the overall eHRs changing over time, including yearly estimates (bullets) and a locally weighted scatterplot smoothing trend line with 95% CIs. Bottom right, estimated eHR changing over time within different subgroups, including heatmaps stratified for stage, morphology, age, and sex. NA, not available; AC, adenocarcinomas. Medical art in the top left panel was adapted from Servier Medical Art by Servier, licensed under a Creative Commons Attribution 3.0 Unported License.

Graphical abstract summarizing main survival trends comparing LCC with RCC (reference). Top right, the overall eHRs changing over time, including yearly estimates (bullets) and a locally weighted scatterplot smoothing trend line with 95% CIs. Bottom right, estimated eHR changing over time within different subgroups, including heatmaps stratified for stage, morphology, age, and sex. NA, not available; AC, adenocarcinomas. Medical art in the top left panel was adapted from Servier Medical Art by Servier, licensed under a Creative Commons Attribution 3.0 Unported License.