
Figure 4.
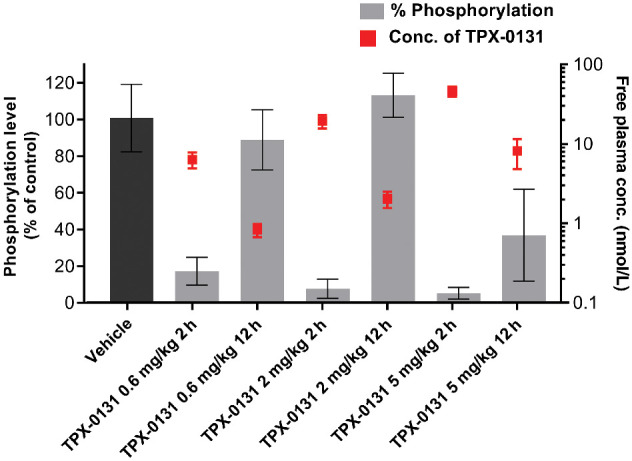
Pharmacokinetic/pharmacodynamic analysis of TPX-0131 in the EML4-ALK G1202R/L1196M xenograft model. Bar graph quantitates the degree of phosphorylation (Tyr1282/12833) modulation of ALK as a function of dose. The TPX-0131 unbound exposure is shown as red squares. Higher TPX-0131 exposure correlates with lower levels of ALK phosphorylation. Primary data can be found in the supplemental information (Supplementary Fig. S3).