. 2021 Jul 12;20(10):1789–1799. doi: 10.1158/1535-7163.MCT-21-0228

Figure 3.

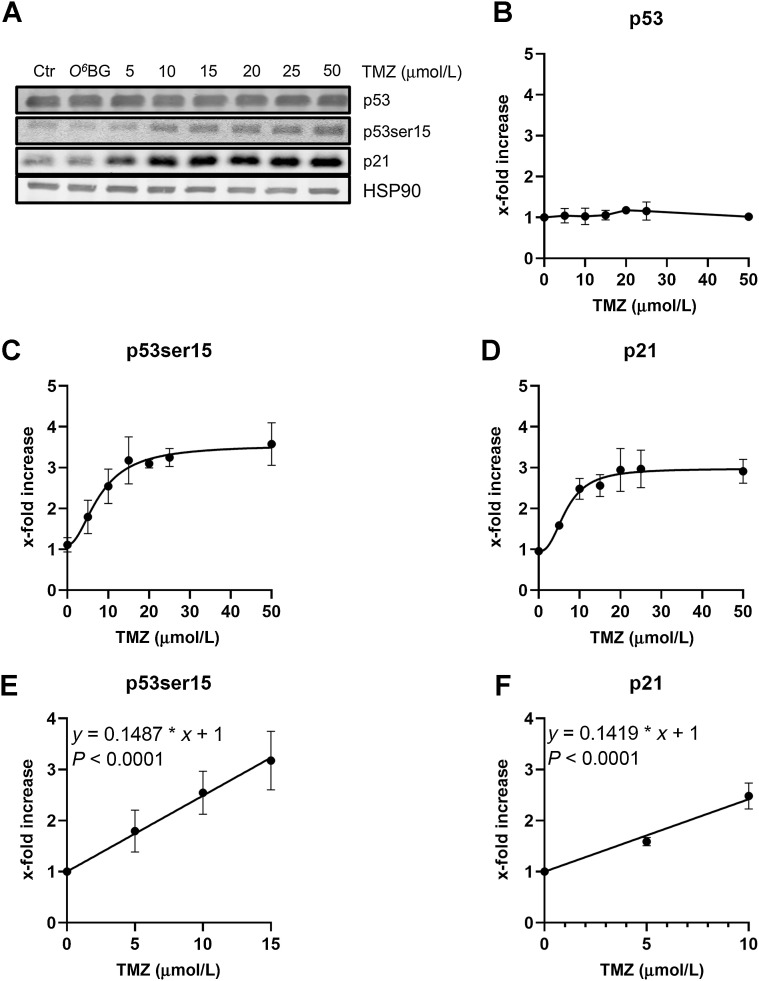
Figure 3. Amount of p53, p53ser15, and p21 in A172 cells treated with various doses of temozolomide. A, Exponentially growing cells were harvested 120 hours after treatment with TMZ. HSP90 was used as loading control. A representative Western blot analysis is shown. Quantification of p53 (B), p53ser15 (C), and p21 (D) in A172 cells treated with TMZ. Data are the mean of three independent experiments ± SEM. Dose response for p53ser15 (E) and p21 (F) in A172 cells at the low TMZ dose range (up to 15 μmol/L). The curves do not indicate a threshold dose.

Amount of p53, p53ser15, and p21 in A172 cells treated with various doses of temozolomide. A, Exponentially growing cells were harvested 120 hours after treatment with TMZ. HSP90 was used as loading control. A representative Western blot analysis is shown. Quantification of p53 (B), p53ser15 (C), and p21 (D) in A172 cells treated with TMZ. Data are the mean of three independent experiments ± SEM. Dose response for p53ser15 (E) and p21 (F) in A172 cells at the low TMZ dose range (up to 15 μmol/L). The curves do not indicate a threshold dose.