
Figure 2.
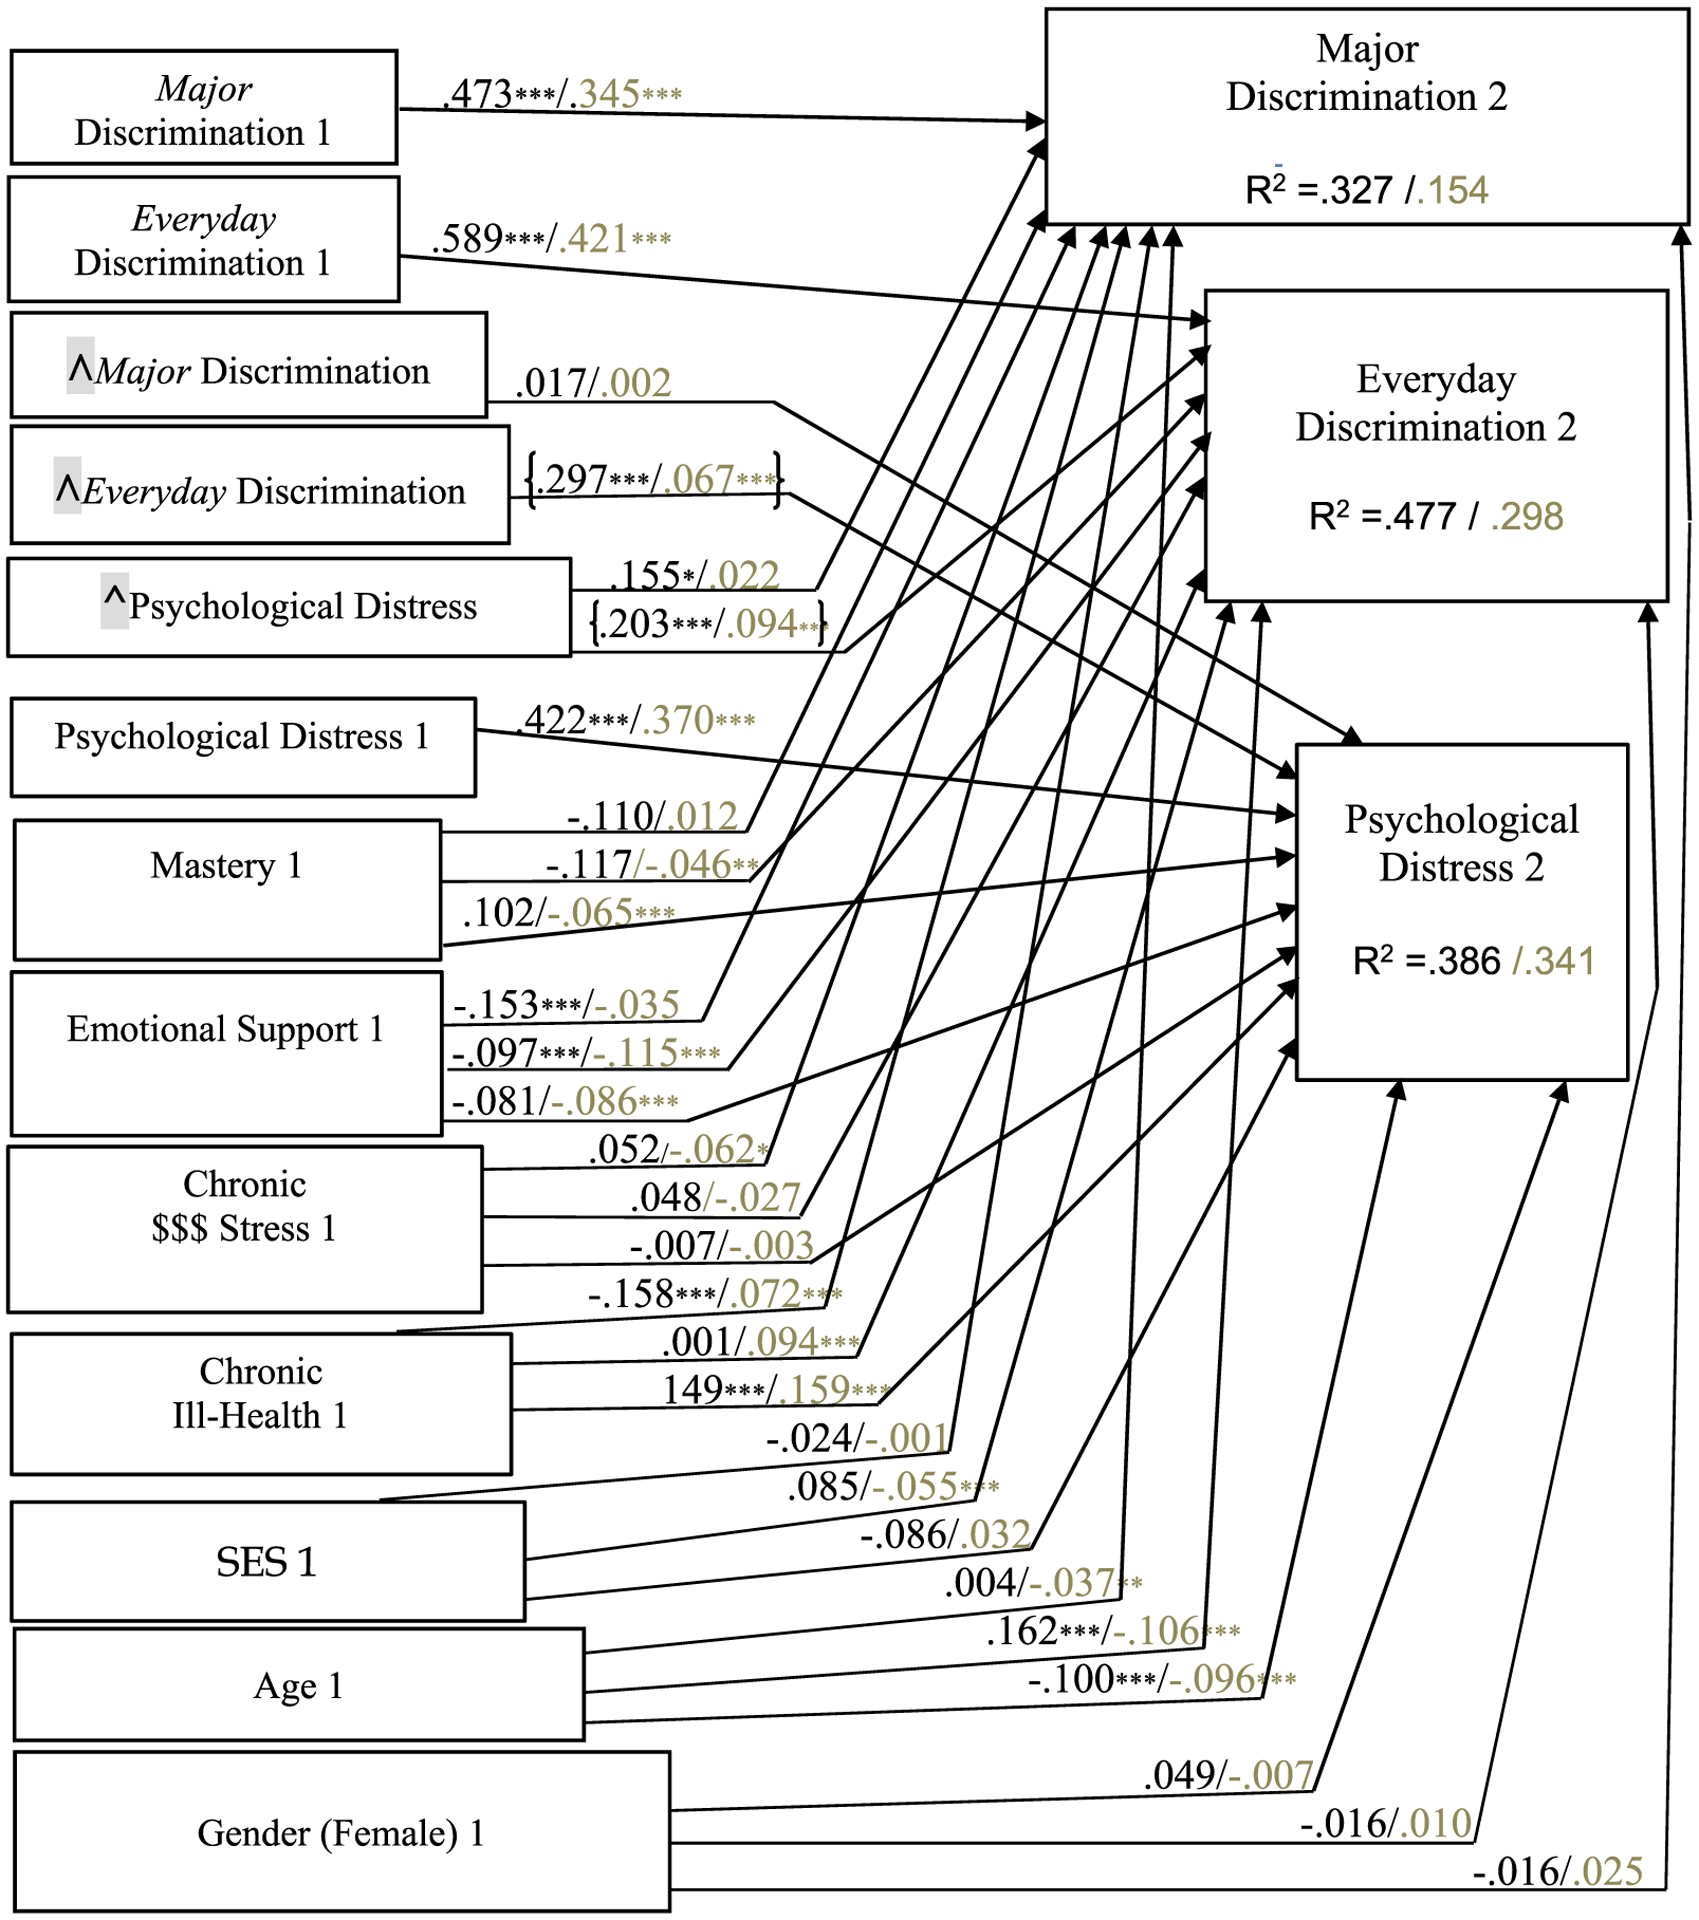
Fully standardized coefficients (darker font = Blacks/lighter font = Whites) from the structural segment of the LISREL model: MIDUS Wave 1 (1995–6) and Wave 2 (2004–6) data. N = 3561 Whites/163 Blacks. * p < .05; **p < .01; *** p < .001. Effects of focal predictors differing significantly across races are bracketed.