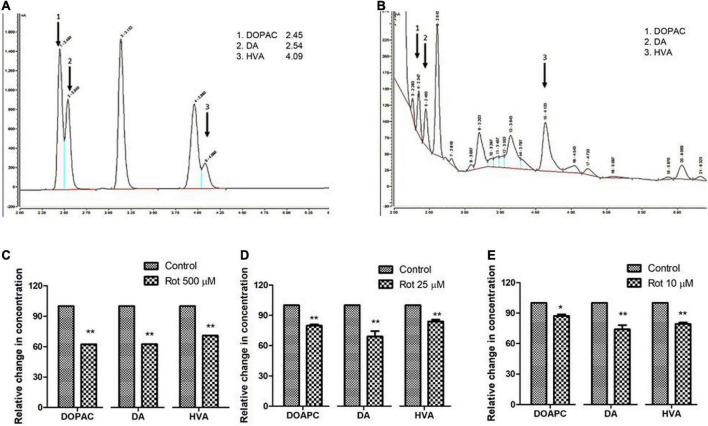
FIGURE 5.
Quantification of DA and its metabolites, HVA, and DOPAC using HPLC in fly brain homogenate: Chromatogram of standard DA, HVA, and DOPAC (A) shows specific retention time and chromatogram for fly brain tissue extract (B). The relative level of DA and its metabolites at the selected time points in three stages of the life span, that is, early health span (C); late health span (D); transition phase (E) indicates diminished levels of DA, HVA, and DOPAC illustrating altered DA metabolism in brain-specific fashion in the PD model. Statistical analysis was performed using a t-test (compared to control). *p < 0.05, **p < 0.001.

