

Introduction
Standard automated perimetry (SAP) is used to diagnose glaucoma, stage disease severity, and monitor for progression. The Humphrey Field Analyzer (HFA), a widely used perimeter, provides information on both the visual field (VF) and on the potential reliability of those findings. Less reliable VF test results tend to be more variable and may complicate the diagnosis and management of glaucomatous field loss.1,2 Standard reliability metrics include fixation losses (FL), false positive (FP) responses, and false negative (FN) responses. Studies suggest that FP responses are the most relevant reliability metric.3,4 In contrast, FN response rates are less relevant and often are increased in advanced disease, and FL rates have shown little relation to test reliability.3,5,6 Prior manufacturer guidelines recommended reliability limits of 20% for FL, 15% for FP, and provided no limit recommendations for FN.7 Updated manufacturer guidelines will give no recommended limit for any reliability metrics, but have not been widely adopted yet.
Longer VF tests place a greater burden on patients and clinical staff, and also decrease the reliability of VF testing.3,8 The SITA (Swedish Interactive Thresholding Algorithm) Faster testing protocol was recently introduced on the HFA to further decrease testing times. One of the ways that SITA strategies reduce testing time is by removing FP catch trials and instead estimating FPs on the basis of patient response time measurements.9 SITA Faster further decreases testing time, in part, by entirely removing FN catch trials.10 SITA Faster also is programmed to default to the use of gaze tracking (GT) instead of FL catch trials. GT measures degrees of gaze deviation during stimulus presentation and also reports in real time any GT failures. GT metrics are presented to clinicians on a visual scale that requires subjective interpretation, as opposed to the objective measures provided for standard reliability metrics.
Several studies have investigated the relationship between GT metrics and VF reliability by examining stability of visual fields over time.11–15 However, the baseline characteristics of GT metrics in large samples have been minimally characterized. There is also little information directing clinical judgment of field reliability based on GT metrics. In this study, we examined the relationship between standard and GT reliability metrics and provide recommendations for interpretation of GT displays.
Methods
The study protocol was approved by the Veterans Administration San Diego Medical Center (VASDMC) Institutional Review Board and adhered to the tenets of the Declaration of Helsinki. A waiver of consent was obtained to review retrospective VF data.
Study Participants
Glaucoma and glaucoma suspect patients who were at least 18 years old and had a VF performed in ophthalmology and optometry clinics at the VASDMC from December, 2018 to February, 2019 were eligible for the study. Patients were included if they had an HFA (Carl Zeiss Meditech Inc, Dublin, CA, USA) 24-2 SITA Fast VF performed on both eyes and had previously performed at least one VF. There were no exclusion criteria for poor reliability or degree of field loss. The most recent VF was used for patients that completed more than one eligible VF during the study period. Data including patient age and gender, as well as visual field index (VFI), mean deviation (MD), and pattern standard deviation (PSD) were recorded for all included patients. Patients were classified as having mild visual field loss (MD>−6), moderate visual field loss (−6>MD>−12), or advanced visual field loss (−12>MD).
Visual Field Reliability
Standard HFA reliability metrics, including FL, FP, and FN, were recorded for all patients. GT metrics were also recorded from the HFA visual field test reports; they quantify any gaze deviation detected during each stimulus presentation. Upward bars represent gaze deviations and increasing bar sizes indicate larger gaze deviations. Downward bars represent failures to capture a signal (Figure 1). VFs were exported as JPEG images from Zeiss Forum (Carl Zeiss Meditech Inc, Dublin, CA, USA) and GT metrics were extracted using ImageJ (ImageJ 1.8.0, National Institutes of Health, Bethesda, MA, USA). Similar to prior gaze tracking studies, GT metrics were calculated as the percent of stimuli with gaze deviations between 1 and 2 degrees (M1), 3-5 degrees (M3), 6 degrees or greater (M6), and percent of stimuli with tracking failure (TFF or Tracking Failure Frequency).11 The percent of stimuli with any gaze deviation (Tmove) and the total number of degrees of eye movements (Tmag) were also calculated.
Figure 1.
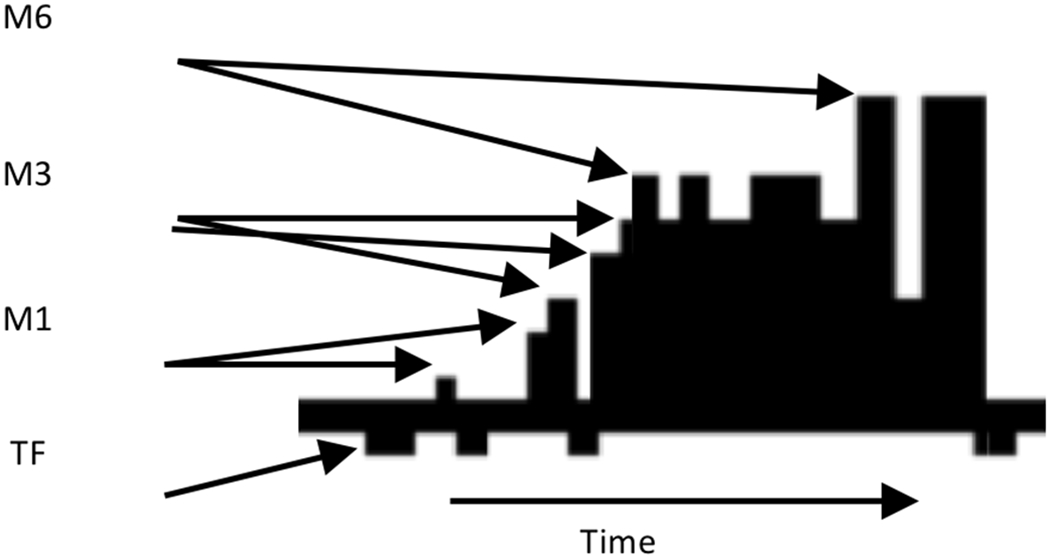
GT parameters.
Statistical Analysis
We report Spearman’s rank-based correlation coefficient as a measure of the magnitude of the relationship between standard HFA visual field reliability indices and GT metrics. The significance of this relationship was determined with generalized estimating equations (GEE), with an exchangeable working correlation assumed to account for within-patient correlation. We also computed the area under the receiver operating characteristic (AUROC) curve and sensitivities at fixed specificities to compare binarized standard visual field reliability index values with GT metrics, with bias-corrected confidence intervals determined by a clustered bootstrap procedure. For this analysis, visual field reliability metrics were binarized at 33%, 20%, and 15% for FN, FL, and FP respectively.
Results
988 eyes of 494 patients were included in the study. Patient characteristics, VF characteristics, and results for HFA reliability metrics are presented in Table 1. Patients had a mean age of 66.3 years and were largely male (93.9%), as is typical for VA-based studies. A majority of eyes had mild visual field loss (837 eyes, 84.7%); 98 eyes (9.9%) had moderate visual field loss, and 53 eyes (5.4%) had advanced visual field loss. Although there were no exclusion criteria for severe field loss, only 12 patients had VFs with MD less than −20 dB in one eye (1.2%) and no patient had a VF with an MD less than −20 dB in both eyes. All GT metrics other than Tmove were skewed to the right (Figure 2). Representative graphs of average GT metrics are presented in Figure 3.
Table 1:
Patient and visual field characteristics.
| N = 494 (988 Eyes) | |
|---|---|
| Demographics | Mean (standard deviation) |
| Age (years) | 66.3 (11.3) |
| Sex (% Female) | 6.1% |
| Visual Field Characteristics | Mean (standard deviation) |
| VFI (percent) | 92.8 (12.4) |
| MD (dB) | −2.73 (4.68) |
| PSD (dB) | 3.53 (3.05) |
| FL (percent) | 16.9 (0.22) |
| FP (percent) | 3.83 (7.19) |
| FN (percent) | 4.59 (7.21) |
| Gaze Tracking Metrics | Mean (standard deviation), upper 95th percentile |
| M1 (percent) | 28.6 (20.7), 66.7 |
| M3 (percent) | 24.6 (21.8), 67.5 |
| M6 (percent) | 10.5 (17.3), 49.5 |
| TFF (percent) | 17.0 (27.9), 79.8 |
| Tmove (percent) | 62.4 (26.4), 95.2 |
| Tmag (degrees) | 504 (337), 1173 |
Figure 2.
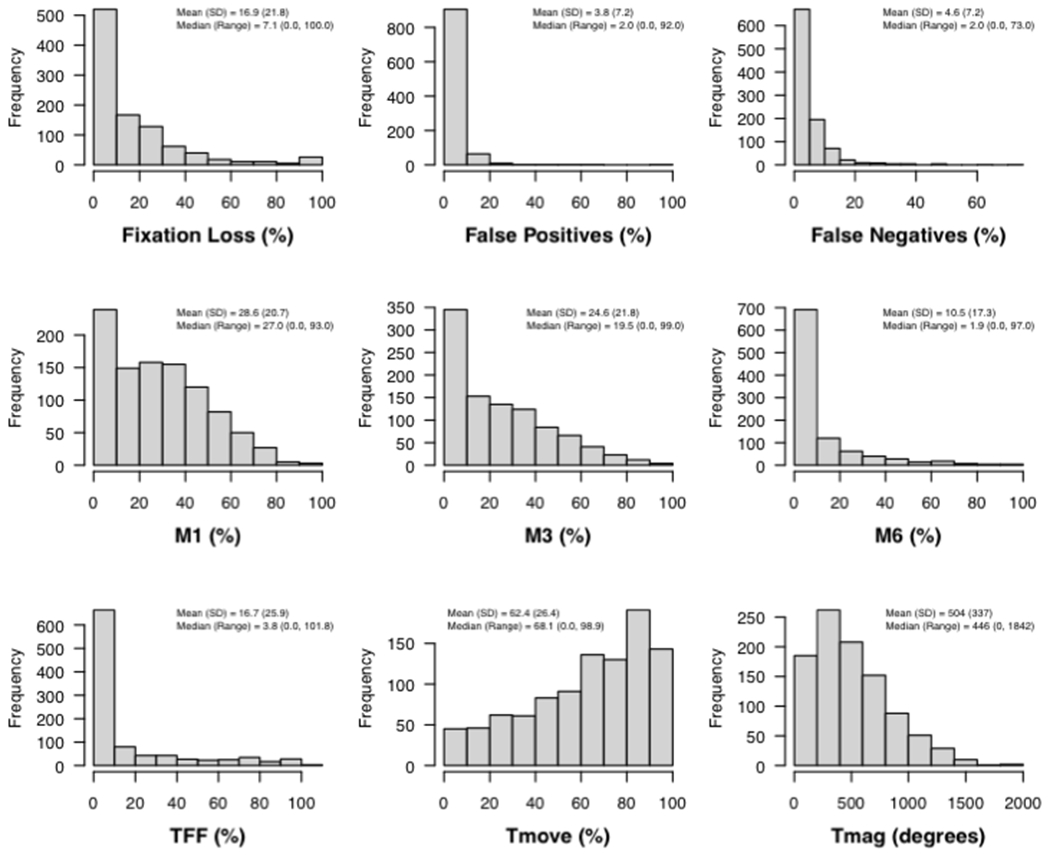
Distribution of standard and GT reliability metrics.
Figure 3.
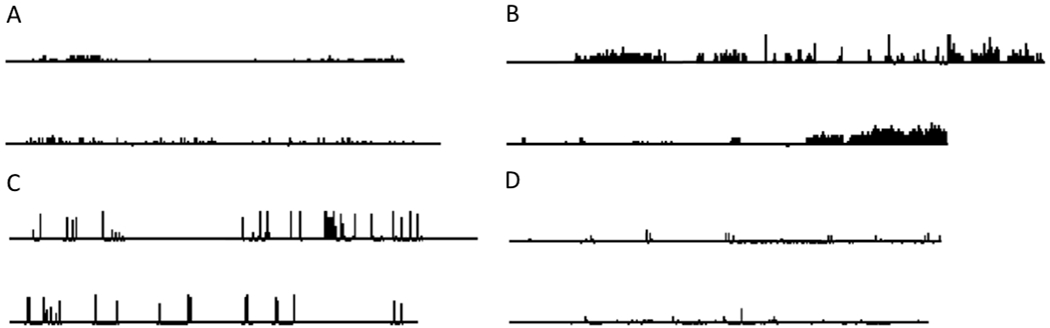
Representative GT figures with average GT metrics. A. Average M1. B. Average M3. C. Average M6. D. Average TFF.
Based on the previous manufacturer’s recommended limits for standard reliability metrics, 327 eyes (33%) would be rejected for high FL and 35 eyes (3.5%) would be rejected for high FP. Although there are no manufacturer suggested FN reliability limits, 52 eyes (5.3%) had FN greater than 20%. We observed statistically significant correlations by generalized estimating equations between GT metrics and both FL and FN (Table 2 and Figure 4), though the magnitudes of the correlation coefficients were generally low. The strongest association was between FL and M6 with a Spearman correlation value of 0.26 (p-value <0.001). We note that, though statistically significant due to our large sample size, the magnitude of each correlation coefficient between standard reliability and GT metrics is relatively small (all Spearman correlation coefficients < 0.3). As an additional analysis to lessen the impact of outliers, a square-root transformation was applied to both visual field and gaze tracking metrics prior to GEE analysis. After transformation, there was a significant relationship between FP and TFF (p = 0.008). Results for both FL and FN were similar (data not shown).
Table 2:
Spearman correlation coefficient (p-value) between traditional reliability and gaze tracking metrics.
| Fixation Loss | False Positives | False Negatives | |
|---|---|---|---|
| M1 | −0.09 (< 0.001) | −0.06 (0.502) | −0.08 (0.018) |
| M3 | 0.10 (0.082) | 0.02 (0.056) | 0.07 (0.539) |
| M6 | 0.26 (< 0.001) | 0.12 (0.654) | 0.19 (0.051) |
| TFF | 0.16 (0.010) | 0.14 (0.204) | 0.20 (0.015) |
| TMove | 0.02 (0.149) | −0.02 (0.130) | −0.01 (0.948) |
| TMag | 0.18 (< 0.001) | 0.06 (0.819) | 0.17 (< 0.001) |
Figure 4.
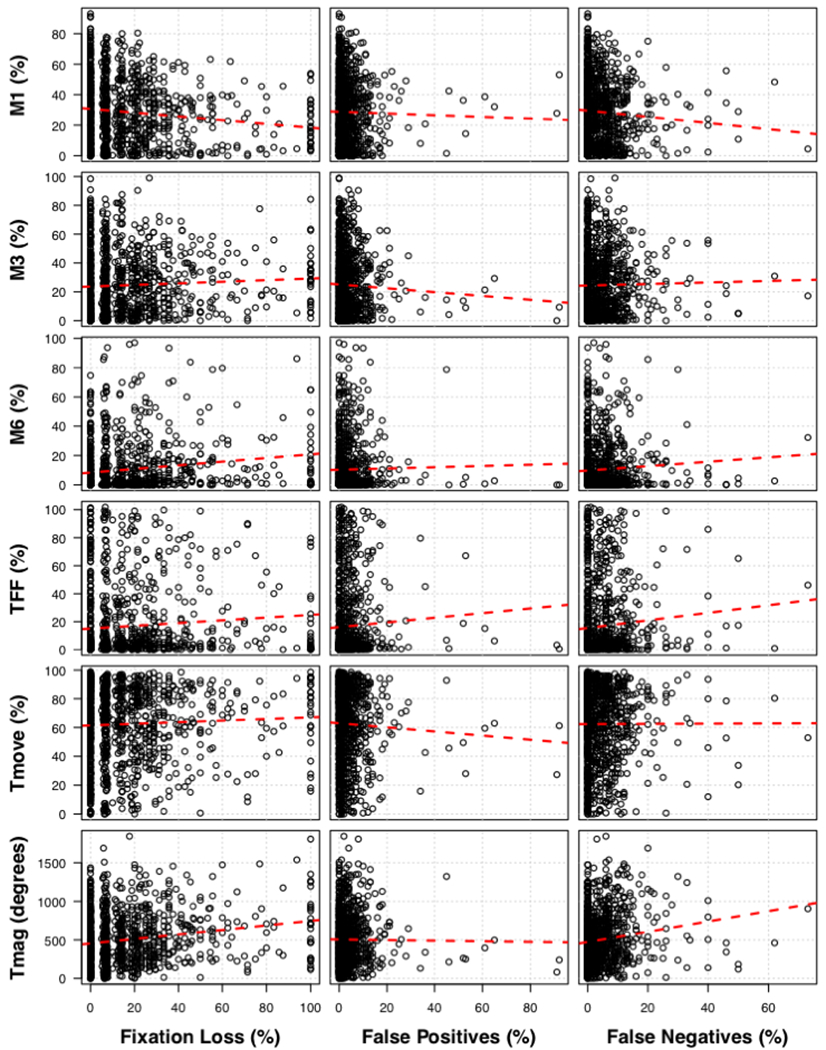
Scatter plots of standard and GT reliability metrics.
The highest AUROC for predicting FN binarized at 33%, 20%, and 15% were 0.602 (95% confidence interval (CI) 0.482 to 0.767), 0.593 (95% CI 0.493 to 0.690), and 0.603 (95% CI 0.518 to 0.687), respectively, each being achieved by TFF. Peak sensitivities at 80% specificity for these outcomes were achieved by TFF (36% sensitivity), Tmag (38% sensitivity), and Tmag (36% sensitivity), respectively. The highest AUROC for predicting false positives binarized at 33%, 20%, and 15% were 0.671 (95% CI 0.482 to 0.767, by Tmove), 0.564 (0.465 to 0.671, by Tmove), and 0.596 (0.500 to 0.690, by TFF), respectively. Peak sensitivities at 80% specificity for these outcomes were achieved by Tmove (30% sensitivity), TFF (20% sensitivity), and TFF (22% sensitivity).
Ninety-fifth percentile limits were determined for GT metrics (Table 1). Representative GT plots for M1, M3, M6, and TFF at the 95th percentile limit are presented in Figure 5. There was a negative correlation between M1 and M6 and TFF, a stronger positive correlation between Tmove and M3 and between Tmag and M3, M6, and Tmove, and a stronger negative correlation between Tmove and TFF (Table 3, Figure 6). 32 eyes (3.2%) had multiple GT metrics past the 95th percentile limit. Of these, a majority (28 eyes, 87.5%) reached the limit for both M6 and Tmag, with the remaining 4 eyes reaching the limit for both M3 and Tmag.
Figure 5.
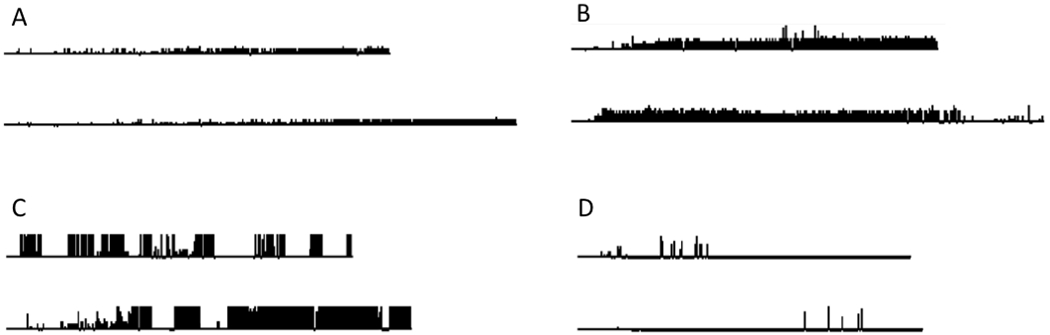
Representative GT figures of 95% GT limit. A. Above limit M1. B. Above limit M3. C. Above limit M6. D. Above limit TFF.
Table 3:
Spearman correlation coefficient between gaze tracking metrics.
| M1 | M3 | M6 | TFF | TMove | TMag | |
|---|---|---|---|---|---|---|
| M1 | 1.00 | |||||
| M3 | −0.04 | 1.00 | ||||
| M6 | −0.55 | 0.26 | 1.00 | |||
| TFF | −0.51 | −0.21 | 0.28 | 1.00 | ||
| TMove | 0.23 | 0.75 | 0.23 | −0.48 | 1.00 | |
| TMag | −0.20 | 0.74 | 0.64 | −0.13 | 0.81 | 1.00 |
Figure 6.
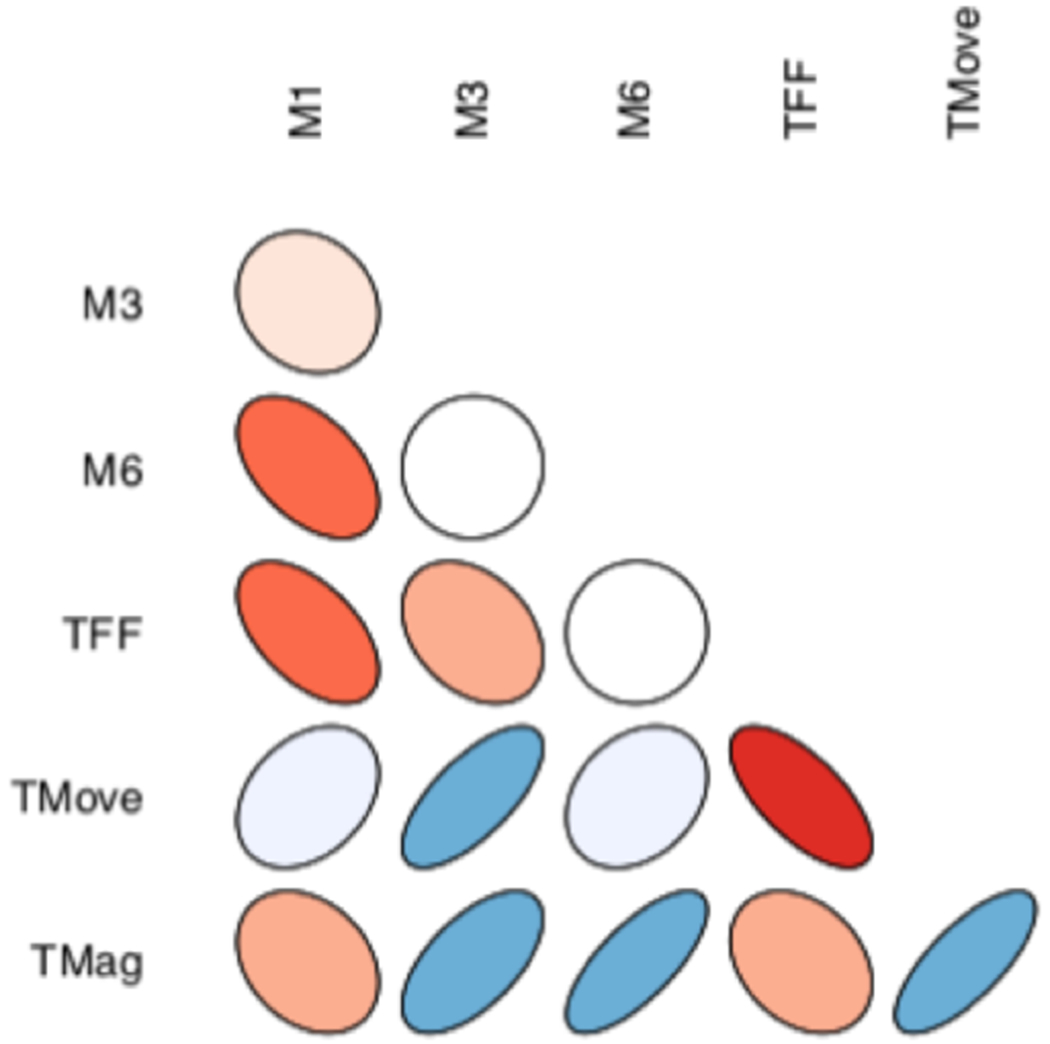
Correlation ellipses between GT metrics. Warm colors represent negative correlations while cool colors represent positive correlations. Stronger correlations are represented by darker colors and tighter ellipses.
Standard and GT reliability metrics were also examined in relation to severity of VF loss (Table 4). Patients had increased FN responses as VF severity worsened in the tested eye (p<0.001). Eyes with moderate VF loss had lower M1 than eyes with mild or advanced VF loss (p<0.001). Finally, eyes with mild VF loss had lower M6 than eyes with moderate and advanced VF loss (p=0.012). Additionally, the 18 eyes with MD greater than +2 dB had significantly elevated FP rates (mean FP 32.5%, p<0.001). When disease stage was included in the GEE model as a moderating effect, the only significant moderation of relationships between standard reliability and GT metrics occurred between FL and TFF (p=0.015) due to a higher correlation in patients with advanced VF loss and between FN and Tmag (p=0.005) due to higher correlation in patients with mild VF loss.
Table 4:
Mean standard and gaze tracking metrics by visual field severity.
| Mild | Moderate | Advanced | p-value | |
|---|---|---|---|---|
| FL | 16.5% | 20.9% | 16.9% | 0.156 |
| FP | 3.9% | 3.7% | 3.0% | 0.352 |
| FN | 3.4% | 8.0% | 16.5% | <0.001 |
| M1 | 29.6% | 20.3% | 29.1% | <0.001 |
| M3 | 24.1% | 29.3% | 23.5% | 0.089 |
| M6 | 9.7% | 14.9% | 14.9% | 0.012 |
| TFF | 16.0% | 23.2% | 15.7% | 0.057 |
Discussion
In this study, standard reliability metrics for HFA perimetry were compared to GT metrics in a large sample of patients. There was no clinically significant correlation between standard reliability metrics and GT metrics. Although there was a significant statistical correlation of FL and FN with M1, M6, and TFF, area under the curve calculations and low correlation coefficients indicate that these correlations were largely due to the sample size and have little practical significance. Likewise, although the GEE model demonstrated an association between FL and TFF in advanced VF loss and between FN and Tmag in mild VF loss, this association is of unclear clinical significance. This suggests that GT may provide alternative or complementary metrics for monitoring visual field reliability. In our sample we used binary cutoffs for GT metrics based on the approximate 95th percentile limit of patients in this study population. However, further study will be needed to determine the validity of binary cutoffs as well as further refine the cutoff values.
As VF testing moves toward faster algorithms by omitting standard reliability catch trials and GT methods become more refined, GT metrics may become increasingly important reliability parameters. Standard HFA reliability metric limits were initially proposed by the manufacturer and were later validated and refined with normative databases.16–18 Our study comprises a larger database of glaucoma and glaucoma suspect patients than those used in prior studies of standard reliability metrics and significantly enhances understanding of what 50th and 95th percentile GT responses represent. The clinician may be aided in the subjective assessment of GT metrics through representations of GT figures at these percentiles in Figure 3 and Figure 5. The need to subjectively review GT figures is a large limitation in the presentation of GT metrics and could be obviated by the manufacturer presenting objective measurements rather than a subjective line graph.
M1, M3, M6, and TFF all appear to be promising GT metrics. The metrics are relatively independent from one another. There was a mild negative correlation between metrics as expected. Given the average movement time (Tmove) was greater than 62% of the test time, an increase in any single metric is associated with mild decreases in other metrics. Aggregate GT metrics in the form of Tmove and Tmag, which have been used in prior studies, did not aid in reliability assessments.11–14 Tmove had a broad distribution with a 95th percentile cutoff nearing 100% eye movement and is likely to be of minimal clinical significance. Tmag is closely associated with large eye movements (M6 and, to a lesser degree, M3) and did not present a useful independent variable. Future studies will likely find little benefit in including aggregate GT metrics in the study of VF reliability.
Both standard reliability and GT metrics are influenced by field loss severity. FN increased as VF severity worsened, as has been demonstrated in prior studies.3,5,6 Large eye movements (M6) were less common in eyes with mild VF loss, but were similar in eyes with moderate and advanced VF loss. Prior studies also found increased degree of eye movement to be related to severity of VF loss, although they found M3 also increased in eyes with more advanced VF loss.12 This may be because eyes with greater VF loss demonstrate more searching behavior when attempting to fixate. Small eye movements (M1) showed a significant association with VF loss but the relationship was non-linear and the significance was likely due to large sample size. Prior studies did not demonstrate any relationship between VF severity and small eye movements, and the variability seen in this study may be because eye movements of less than three degrees are common even in healthy eyes.12,19
The study has several limitations. First, the study sample was drawn from VA hospital outpatient veterans, so the patients enrolled were overwhelmingly male and may not be representative of other populations. Second, the study establishes GT limits based on the number of patients exceeding a threshold and provides a binary cutoff. A 95th percentile binary cutoff limit was chosen as the primary comparison to standard reliability metrics, but future studies may find using other cutoffs are more clinically appropriate. Third, given the lack of association between standard reliability and GT metrics, it may be helpful to examine the association of GT metrics with testing variability as an alternative measure of VF reliability. Prior studies looking at VF variability and GT found an association with TFF in three instances and additionally with M3 and M6 in one.11,12,14 However, none of these studies addressed when GT metrics should be regarded suspiciously by clinicians, in comparison to studies of standard reliability metrics that provide criteria to assess reliability.3 Finally, we did not exclude patients that had secondary conditions, such as cerebellar stroke, that could influence fixation behaviors as we hoped to capture the full range of glaucoma and glaucoma suspect patients that may be seen in ophthalmology and optometry clinics.
In summary, the current study shows no clinically significant association between standard reliability and GT metrics. Aggregate GT metrics (Tmove and Tmag) that have been used in prior studies did not aid in reliability assessments. A binary cutoff for GT metrics was used for comparison to standard reliability metrics but can be refined with future study of their association with VF variability.
a. Funding/support:
National Institutes of Health/National Eye Institute Core Grant P30EY022589, an unrestricted grant from Research to Prevent Blindness (New York, NY).
b. Financial Disclosures:
ASC: no financial disclosures. CL: no financial disclosures: VMP: no financial disclosures. JAP: no financial disclosures. RNW: Financial support- National Eye Institute, Carl Zeiss Meditec, Centervue, Heidelberg Engineering, Konan, Optovue, Bausch & Lomb, Topcon; Patent- Carl Zeiss Meditec.
References
- 1.McMillan TA, Stewart WC, Hunt HH. Association of reliability with reproducibility of the glaucomatous visual field. Acta Ophthalmol. 1992;70(5):665–670. doi: 10.1111/j.1755-3768.1992.tb02150.x [DOI] [PubMed] [Google Scholar]
- 2.Gillespie BW, Musch DC, Guire KE, et al. The collaborative initial glaucoma treatment study: Baseline visual field and test-retest variability. Investig Ophthalmol Vis Sci. 2003;44(6):2613–2620. doi: 10.1167/iovs.02-0543 [DOI] [PubMed] [Google Scholar]
- 3.Yohannan J, Wang J, Brown J, et al. Evidence-based Criteria for Assessment of Visual Field Reliability. In: Ophthalmology. Vol 124. Elsevier Inc.; 2017:1612–1620. doi: 10.1016/j.ophtha.2017.04.035 [DOI] [PMC free article] [PubMed] [Google Scholar]
- 4.Montolio FGJ, Wesselink C, Gordijn M, Jansonius NM. Factors that influence standard automated perimetry test results in glaucoma: Test reliability, technician experience, time of day, and season. Investig Ophthalmol Vis Sci. 2012;53(11):7010–7017. doi: 10.1167/iovs.12-10268 [DOI] [PubMed] [Google Scholar]
- 5.Bengtsson B, Heijl A. False-Negative Responses in Glaucoma Perimetry: Indicators of Patient Performance or Test Reliability? | IOVS | ARVO Journals. Investig Ophthalmol Vis Sci. 2000;41(8):2201–2204. [PubMed] [Google Scholar]
- 6.Bengtsson B. Reliability of computerized perimetric threshold tests as assessed by reliability indices and threshold reproducibility in patients with suspect and manifest glaucoma. Acta Ophthalmol Scand. 2000;78(5):519–522. doi: 10.1034/j.1600-0420.2000.078005519.x [DOI] [PubMed] [Google Scholar]
- 7.Heijl A, Patella VM, Bengtsson B. Essential Perimetry: The Field Analyzer Primer. Fourth Ed. Dublin CA: Carl Zeiss Meditec, Inc; 2012. [Google Scholar]
- 8.Aboobakar IF, Wang J, Chauhan BC, et al. Factors predicting a greater likelihood of poor visual field reliability in glaucoma patients and suspects. Transl Vis Sci Technol. 2020;9(1). doi: 10.1167/tvst.9.1.4 [DOI] [PMC free article] [PubMed] [Google Scholar]
- 9.Bengtsson B, Heijl A. SITA Fast, a new rapid perimetric threshold test. Description of methods and evaluation in patients with manifest and suspect glaucoma. Acta Ophthalmol Scand. 1998;76(4):431–437. doi: 10.1034/j.1600-0420.1998.760408.x [DOI] [PubMed] [Google Scholar]
- 10.Heijl A, Patella VM, Chong LX, et al. A New SITA Perimetric Threshold Testing Algorithm: Construction and a Multicenter Clinical Study. Am J Ophthalmol. 2019;198:154–165. doi: 10.1016/j.ajo.2018.10.010 [DOI] [PubMed] [Google Scholar]
- 11.Ishiyama Y, Murata H, Mayama C, Asaoka R. An objective evaluation of gaze tracking in humphrey perimetry and the relation with the reproducibility of visual fields: A pilot study in glaucoma. Investig Ophthalmol Vis Sci. 2014;55(12):8149–8152. doi: 10.1167/iovs.14-15541 [DOI] [PubMed] [Google Scholar]
- 12.Ishiyama Y, Murata H, Asaoka R. The usefulness of gaze tracking as an index of visual field reliability in glaucoma patients. Investig Ophthalmol Vis Sci. 2015;56(11):6233–6236. doi: 10.1167/iovs.15-17661 [DOI] [PubMed] [Google Scholar]
- 13.Ishiyama Y, Murata H, Hirasawa H, Asaoka R. Estimating the usefulness of humphrey perimetry gaze Tracking for evaluating structure–function relationship in glaucoma. Investig Ophthalmol Vis Sci. 2015;56(13):7801–7805. doi: 10.1167/iovs.15-17988 [DOI] [PubMed] [Google Scholar]
- 14.Asaoka R, Fujino Y, Aoki S, Matsuura M, Murata H. Estimating the Reliability of Glaucomatous Visual Field for the Accurate Assessment of Progression Using the Gaze-Tracking and Reliability Indices. Ophthalmol Glaucoma. 2019;2(2):111–119. doi: 10.1016/j.ogla.2019.02.001 [DOI] [PubMed] [Google Scholar]
- 15.Arai T, Murata H, Matsuura M, Usui T, Asaoka R. The association between ocular surface measurements with visual field reliability indices and gaze tracking results in preperimetric glaucoma. Br J Ophthalmol. 2018;102(4):525–530. doi: 10.1136/bjophthalmol-2017-310309 [DOI] [PubMed] [Google Scholar]
- 16.Nelson Quigg JM, Johnson CA, Twelker JD. Response Properties of Normal Observers and Patients During Automated Perimetry. Arch Ophthalmol. 1989;107(11):1612–1615. doi: 10.1001/archopht.1989.01070020690029 [DOI] [PubMed] [Google Scholar]
- 17.Bickler-Bluth M, Trick GL, Kolker AE, Cooper DG. Assessing the Utility of Reliability Indices for Automated Visual Fields: Testing Ocular Hypertensives. Ophthalmology. 1989;96(5):616–619. doi: 10.1016/S0161-6420(89)32840-5 [DOI] [PubMed] [Google Scholar]
- 18.Katz J, Sommer A. Reliability Indexes of Automated Perimetric Tests. Arch Ophthalmol. 1988;106(9):1252–1254. doi: 10.1001/archopht.1988.01060140412043 [DOI] [PubMed] [Google Scholar]
- 19.Demirel S, Vingrys AJ. Eye movements during perimetry and the effect that fixational instability has on perimetric outcomes. J Glaucoma. 1994;3(1):28–35. doi: 10.1097/00061198-199400310-00007 [DOI] [PubMed] [Google Scholar]