
FIGURE 4.
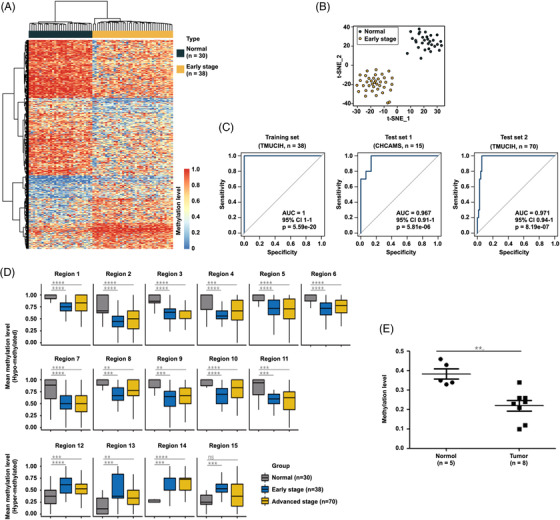
Early detection of breast cancer using circulating tumour DNA (ctDNA) differential methylation regions (DMRs). Heat map (A) and t‐stochastic neighbour embedding (t‐SNE) plot (B) showing the clustering of healthy individuals and patients with early‐stage breast cancer using 583 differentially methylated regions on ctDNA. (C) Receiver operating characteristic curves suggest the classification of healthy individuals and patients with early‐stage breast cancer in the independent training and testing datasets in the two cohorts. The receiver operating characteristic curves suggested the classification of normal individuals and patients with early‐ and advanced‐stage breast cancer in training data and other independent testing datasets using the same 15 differentially methylated regions with potential for biomarkers. (D) Box plot showing the position of 15 potential markers. The mean methylation distribution of 15 optimal ctDNA DMRs biomarkers consisted of 4 hypermethylated and 11 hypomethylated biomarkers in normal samples and early‐ and advanced‐stage breast cancer samples, respectively. Centrelines show the median; boxes represent the interquartile range (25%–75%); whiskers correspond to 1.5 times the interquartile range. p‐Value was computed using a two‐tailed Student's t‐test. ns, p > 0.05; **p ≤ 0.01; ***p ≤ 0.001; ****p ≤ 0.0001. (E) The vertical scatter plot showing the methylation level of ctDNA from healthy controls and breast cancer patients