FIGURE 10.

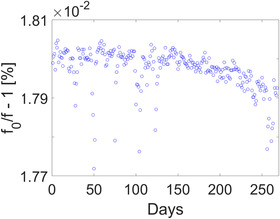
Central frequency measurements over the course of 1 year. Baseline values were approximately 0.018% lower than the nominal with a drift of approximately 0.5% per year

Central frequency measurements over the course of 1 year. Baseline values were approximately 0.018% lower than the nominal with a drift of approximately 0.5% per year