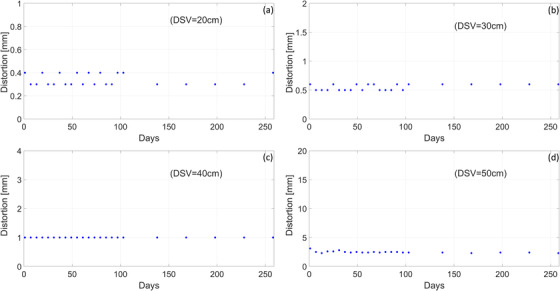
FIGURE 11.

Longitudinal trend of three‐dimensional (3D)‐distortion measurements over the course of 1 year. For each diameter of spherical volume (DSV), the y‐axis is shown in the range of the tolerance level. The quality assurance (QA) test was performed weekly during the first three months of clinical use and monthly thereafter. Maximum distortion for (a) DSV = 20 cm, (b) DSV = 30 cm, (c) DSV = 40 cm, and (d) DSV = 50 cm
