FIGURE 12.

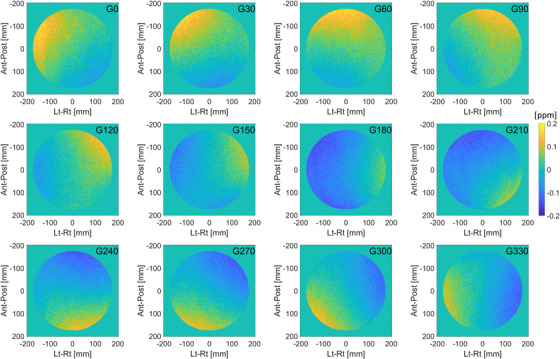
Distribution of B0 as a function of gantry angle. The mean B0‐map across all gantry angles is subtracted from each measurement to remove the static B0 contribution

Distribution of B0 as a function of gantry angle. The mean B0‐map across all gantry angles is subtracted from each measurement to remove the static B0 contribution