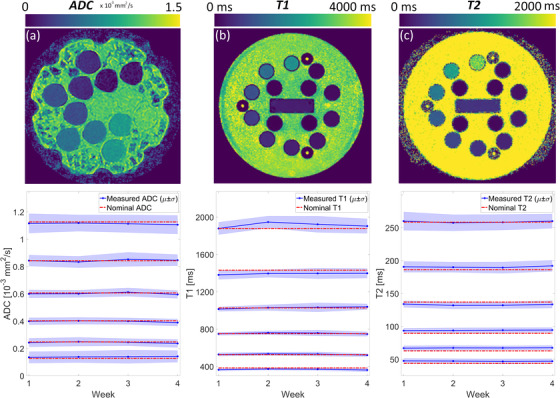
FIGURE 14.

Representative quantitative magnetic resonance imaging (MRI) maps and longitudinal trend for (a) apparent diffusion coefficient (ADC), (b) T1, and (c) T2. Measurements were performed weekly over the course of 4 weeks using two National Institute of Standards and Technology (NIST) traceable phantoms. The mean and standard deviation are measured in a circular region‐of‐interest (ROI) of 1‐cm diameter centered on each vial. Nominal values are given in Tables A1 and A2
