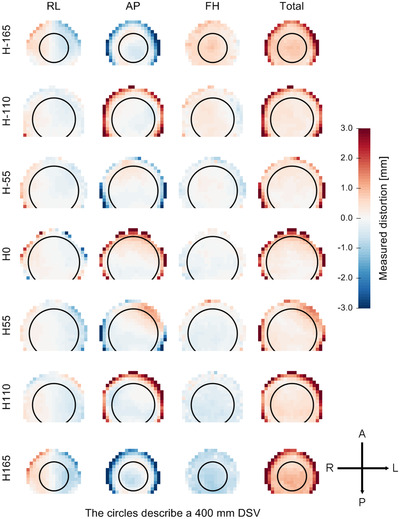
FIGURE A3.

Spatial distribution of geometric distortion measured at the plane of the isocenter and at ±55, ±110, ±165 mm away from the isocenter. The distortion is displayed in the range of ±3 mm. The heatmap is used as a consistency check for qualitative comparisons with baseline measurements. DSV, diameter of spherical volume
