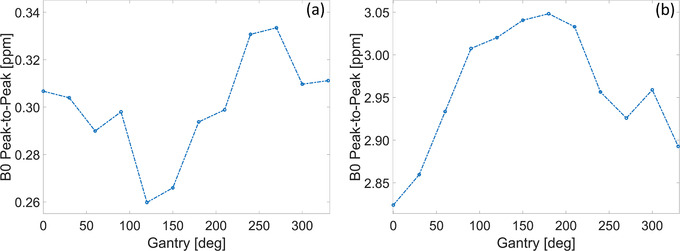
FIGURE A4.

Peak‐to‐peak variation in B0‐maps as a function of gantry angle. (a) The static B0 contribution has been removed to highlight only the gantry dependence. (b) The static B0 contribution has not been removed showing the combined effect with gantry angle. Note that pre‐scan calibration measurements are only acquired at gantry 0° to simulate the worst‐case scenario when magnetic resonance imaging (MRI) imaging begins before and is performed during treatment delivery (e.g., cine acquisition for motion monitoring)
