FIGURE A5.

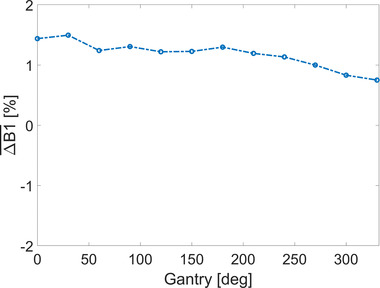
Average percent deviation from the nominal B1 power as a function of gantry angle. Measurements are performed in a large cylindrical phantom with a diameter of 40 cm and analyzed inside a circular region with a diameter of 35 cm

Average percent deviation from the nominal B1 power as a function of gantry angle. Measurements are performed in a large cylindrical phantom with a diameter of 40 cm and analyzed inside a circular region with a diameter of 35 cm