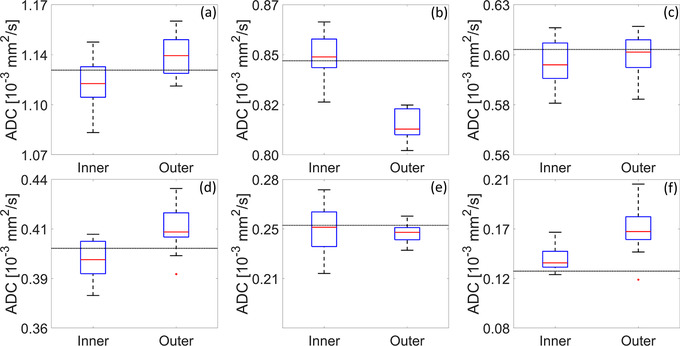
FIGURE A6.

Comparison of apparent diffusion coefficient (ADC) values measured in the inner ring of vials versus the outer ring of vials. Refer to Figure A1 for description of inner/outer ring. For the vials presented in panels (a, b, d, and f), mean ADC values in the inner ring were significantly different from the mean values in the outer ring (t‐test, p << 0.05). Dashed line depicts the nominal value
