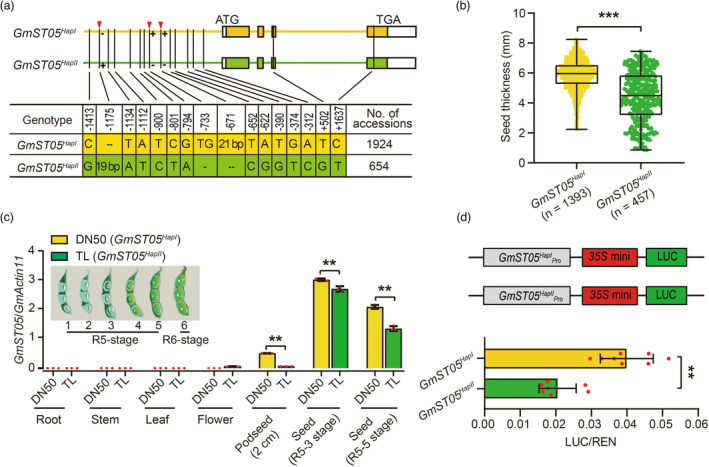
Figure 2.

Two GmST05 haplotypes exhibiting differential expression levels. (a) Schematic representation of the two haplotypes of GmST05. (b) Comparison of seed thickness between two different haplotypes in 1853 soybean accessions. Each dot represents the seed thickness of an accession. All values represent the means ± SDs. Student's t test; *** P < 0.001. (c) qRT‐PCR results of GmST05 expression levels in various organs in DN50 and TL, which contained different haplotypes of GmST05. Values are means ± SDs (n = 3). Student's t test; ** P < 0.01. (d) Transient expression assays of the two GmST05 promoter types in Arabidopsis protoplasts. Values are means ± SDs (n = 8). Student's t test; ** P < 0.01.
