Figure 4.

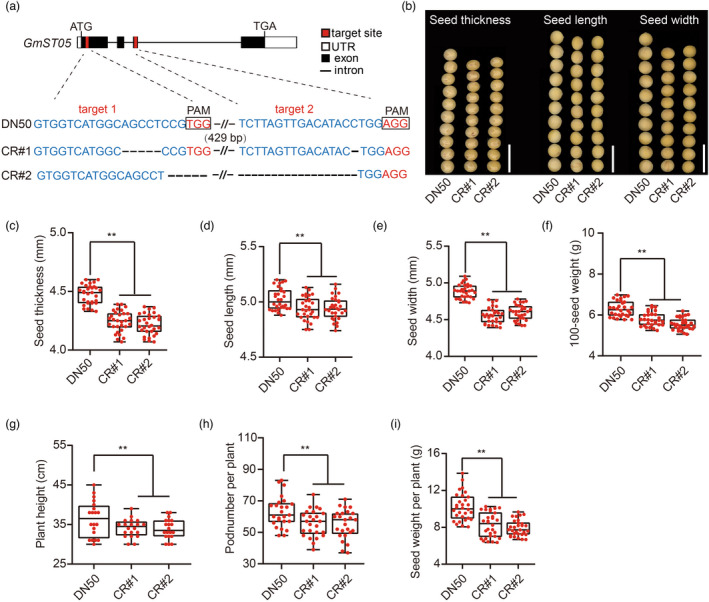
Knockout of GmST05 using CRISPR‐Cas9. (a) Schematics illustrating sgRNA (red lines) targets in the GmST05 coding region. sgRNA targets are highlighted in red. Sequences of the CRISPR‐Cas9‐induced mutant site are shown. (b) Comparison of seed thickness, seed length and seed width between the DN50 and GmST05 HapI knockout lines. Scale bars, 1 cm. (c‐i). Statistical analysis of seed thickness (c), seed length (d), seed width (e), 100‐seed weight (f), plant height (g), pod number per plant (h) and seed weight per plant (i) of DN50 and GmST05 HapI knockout transgenic plants. Values are means ± SDs (for g, n = 20; for others, n = 30; Student's t test; ** P < 0.01).
