. 2022 Aug 23;11:e80047. doi: 10.7554/eLife.80047

Figure 4. Acquisition of POLG2 dataset using SmartScope.

(A) Atlas of the specimen (left), typical micrograph (center) with some particles picked (purple circles) and 2D classes of POLG2 (right). (B) Resulting map of POLG2 colored by local resolution (left) and example of an alpha helix with atomic model fit into the density (left). (C) Masked Fourier-shell correlation curve between half-maps showing a resolution of 3.4Å.

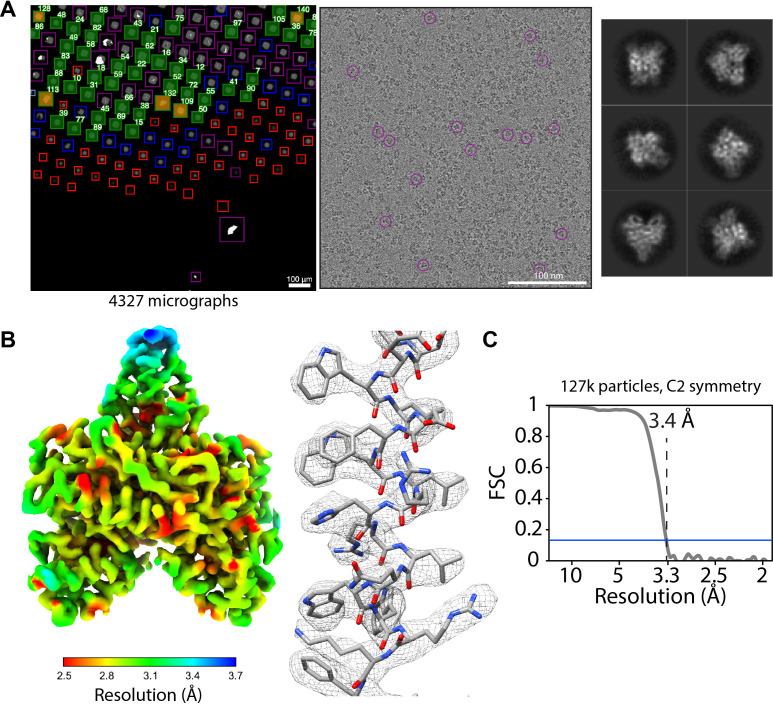
Figure 4.

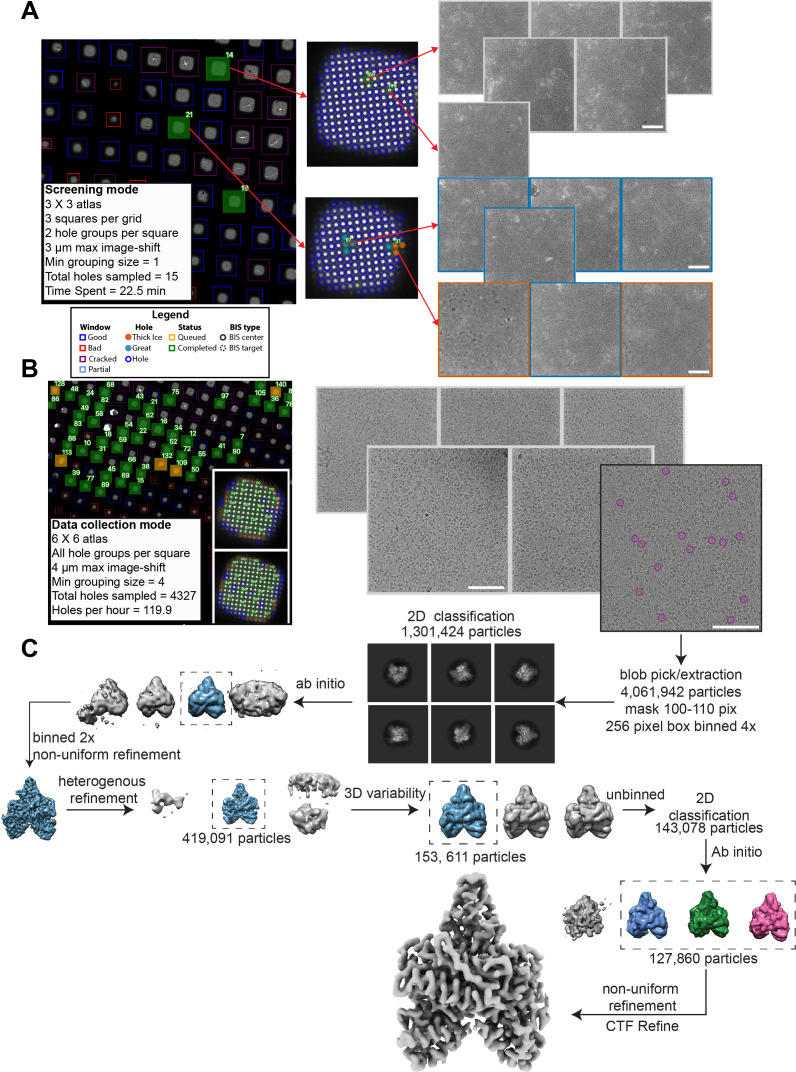
Figure 4—figure supplement 1. Structure determination of POLG2 using SmartScope.

Figure 4—figure supplement 1.

(A) Screening of the specimen used for POLG2 data collection. Sample images from screening are shown. Data can be labeled from the webUI as a way to keep track of the quality. The holes will be colored according to their quality (red: thick ice, blue: great) (white scale bars are 100 nm). (B) Data collection of the same POLG2 specimen with sample squares and micrographs. Purple circles on the micrographs represent POLG2 particles (right). (C) Data processing of the POLG2 dataset using cryoSPARC (Punjani et al., 2017).
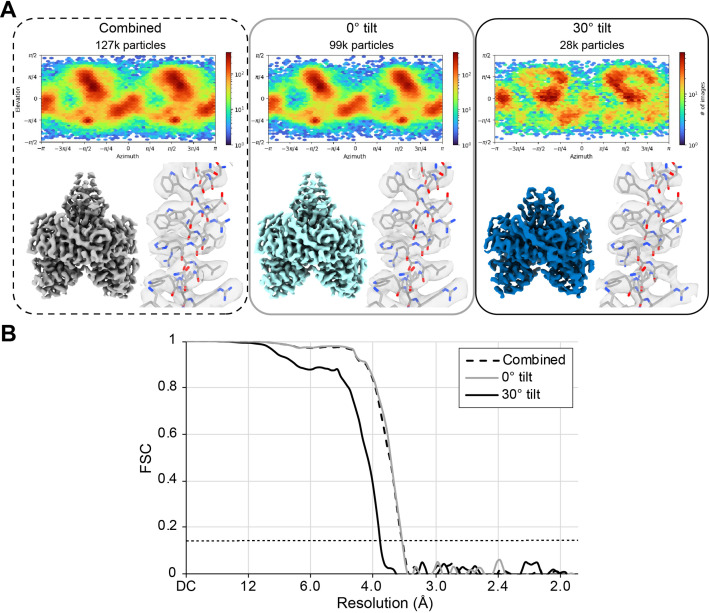
Figure 4—figure supplement 2. POLG2 particles from the areas collected at 0° tilt, 30° tilt, and combined.

Figure 4—figure supplement 2.

(A) For each set, the angular distribution plot, the map and a zoom into a helix where PDB ID: 2G4C was fitted. All maps are displayed at a contour level of 0.6. (B) FSC plot of each set. Resolutions values can be found in Table 1. The horizontal dashed line represents the 0.143 FSC threshold.