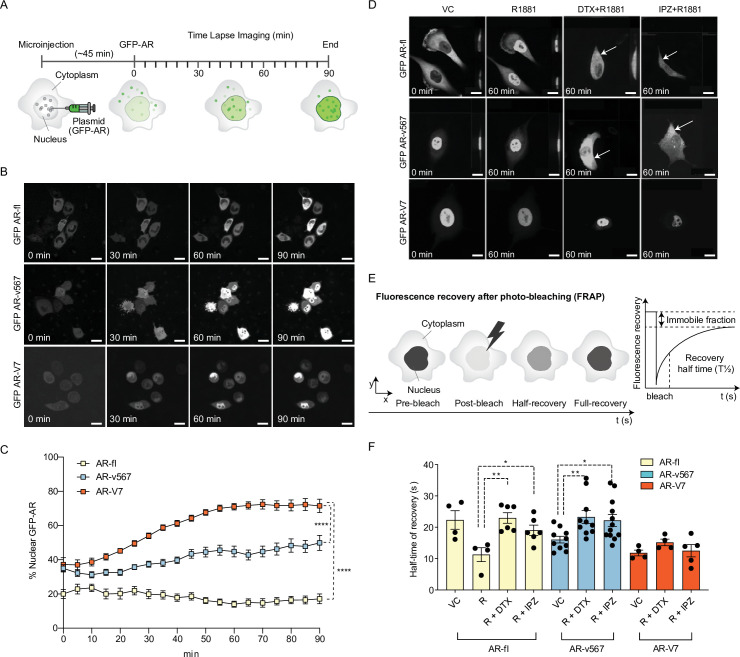
Figure 1. AR-V7 exhibits fast nuclear import kinetics independently of microtubules or the importin-α/β pathway, unlike AR-fl or AR-v567.
(A) Experimental design. Plasmids encoding GFP-tagged AR-fl, AR-v567, or AR-V7 were microinjected into the nuclei of the AR-null PC3 cells. As soon as GFP-tagged proteins were detected in the cytoplasm (~45 min post micro-injection), nuclear translocation kinetics was monitored by live-cell time-lapse confocal microscopy at 5 min intervals for a total of 90 min. (B) Representative time-lapse images showing subcellular localization of each GFP-tagged AR protein. Scale bar, 10 µm. (C) Quantitation of % nuclear GFP-AR protein in single cells (n=3–10 cells/condition/time point). (D) Effect of MT and importin-β inhibitors on AR-fl, AR-v567, and AR-V7 nuclear localization. M12 prostate cancer cells stably expressing GFP-tagged AR-fl or AR-v567 or AR-V7 were treated as indicated and subjected to live-cell time-lapse imaging. R1881: synthetic androgen; DTX: docetaxel, MT-stabilizing drug; IPZ: importazole, importin-β inhibitor. Representative images are shown. Arrows point to cells with cytoplasmic GFP-AR-fl or GFP-AR-v567. Scale bar, 10 µm. (E) Schematic overview of Fluorescence Recovery After Photobleaching (FRAP) assay and its quantitative output. (F) Effect of MT and importin-β inhibitors on AR-fl, AR-v567, and AR-V7 nuclear translocation kinetics following FRAP. T1/2 times in s are shown for each respective protein (n=4–12 cells/condition). Data represent mean ± SEM, p value (*p<0.05, **p<0.01, ****P<0.0001) was obtained using unpaired two-tailed t-test. Experiments were repeated at least twice.
Figure 1—figure supplement 1. AR-V7 exhibits fast nuclear import kinetics independently of microtubules, actin, or the importin-α/β pathway.
Figure 1—figure supplement 2. Dominant negative IPO11 does not abrogate the nuclear import of AR-fl or AR-V7.


