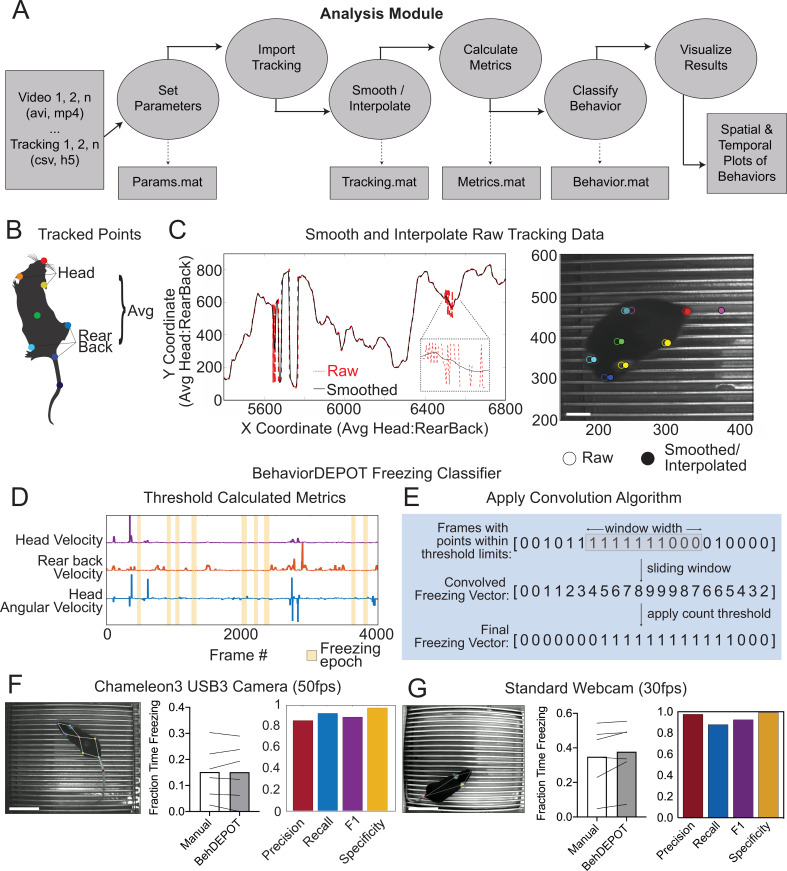
Figure 2. The Analysis Module.
(A) The Analysis Module workflow. Videos and accompanying pose tracking data are the inputs. Pose tracking and behavioral data is vectorized and saved in MATLAB structures to facilitate subsequent analyses. (B) Metrics based on individual tracked points and weighted averages are calculated and stored in BehaviorDEPOT data matrices. (C) Visualization of the effects of the LOWESS smoothing and interpolation algorithms for the weighted average of head and rear back (left) and for all tracked points in a representative example frame (right; scale bar, 2 cm). (D) Visualization of metrics that form the basis of the BehaviorDEPOT freezing heuristic. Colored lines represent framewise metric values. Yellow bars indicate freezing epochs. (E) Visualization of the convolution algorithm employed by the BehaviorDEPOT freezing heuristic. A sliding window of a specified width produces a convolved freezing vector in which each value represents the number of freezing frames visible in the window at a given frame. An adjustable count threshold converts the convolved freezing vector into the final binary freezing vector. (F) Evaluation of freezing heuristic performance on videos recorded at 50 fps with a high resolution, high framerate camera (p=0.95, paired t-test, N=6; Precision: 0.86, Recall: 0.92, F1: 0.89, Specificity: 0.97). Scale bar, 5 cm. (G) Evaluation of freezing heuristic performance on videos recorded at 30fps with a standard webcam (p=0.10, paired t-test, N=6; Precision: 0.98, Recall: 0.88, F1: 0.93, Specificity: 0.99). Scale bar, 5 cm.
Figure 2—figure supplement 1. Performance of the freezing heuristic based on DLC mean tracking error.
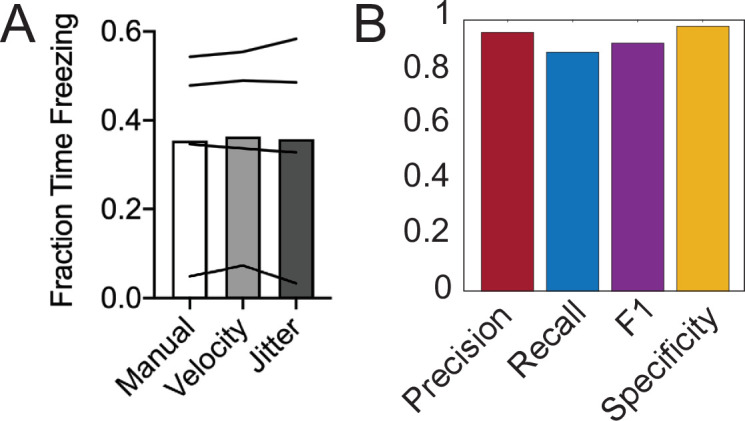
Figure 2—figure supplement 2. Performance of the ‘Jitter’ Freezing Heuristic on Webcam videos.


