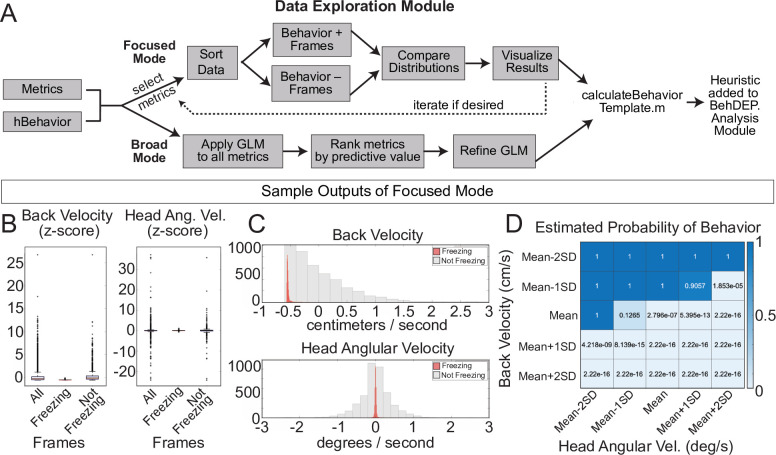
Figure 8. The Data Exploration Module.
(A) The Data Exploration Module takes in metrics from the Analysis Module along with reference annotations. It sorts the data, separating frames containing the behavior of interest from those without and then visualizes and compares the distribution of values for metrics of interest. (B) Distributions of Z-scored values for head velocity (left) and change in head angle (right) are distinct for freezing vs. not freezing frames. Box plots represent median, 25th, and 75th percentile. Error bars extend to the most extreme point that is not an outlier (C) Histograms showing distribution of Z-scored values for back velocity (top) and head angular velocity (bottom) for freezing (red) vs. not-freezing (grey) frames. (D) A generalized linear model (GLM) computes the predictive power of given metrics for frames containing the behavior of interest.

