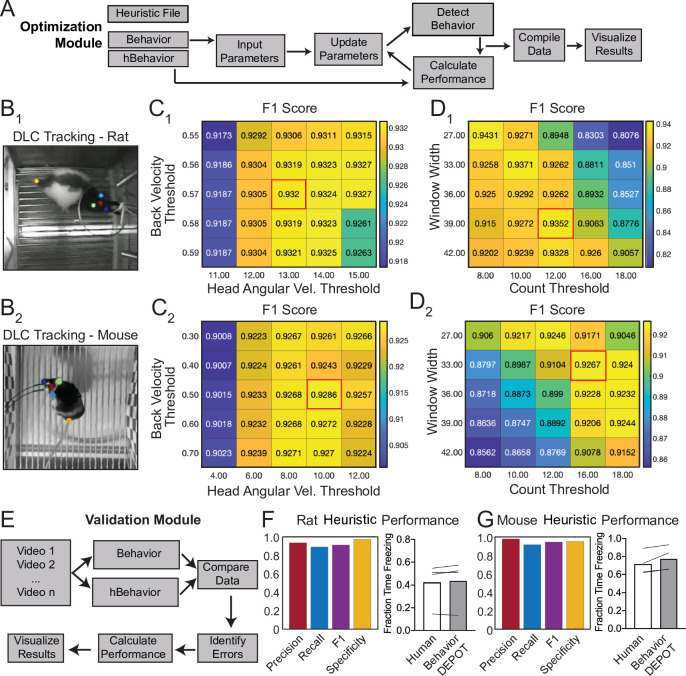
Figure 9. Analysis of External Data using Optimization and Validation Modules.
(A) Optimization Module workflow. This module sweeps through a range of thresholds for metrics calculated based on tracked points and then compares the resulting behavioral classification to human annotations. (B1,2) DLC tracking in rat and mouse freezing in videos obtained from other laboratories. (C1,2) Heatmaps showing F1 scores following iterative sweeps through a range of thresholds for two metrics: back velocity and angular velocity of the head. Red box marks highest F1 score. (D1,2) F1 scores from a subsequent sweep through two additional value ranges for window width and count threshold from the smoothing algorithm. Red box marks highest F1 score. (E) Validation Module workflow. (F) The BehaviorDEPOT heuristic performed robustly on videos of rats recorded in a different lab (Precision = 0.93; Recall = 0.88; F1=0.91; Specificity = 0.96). BehaviorDEPOT freezing detection was comparable to highly trained human raters (N=4 videos, P=0.89, Mann-Whitney U). (G) The BehaviorDEPOT heuristic performed robustly on videos of mice recorded in a different lab (Precision = 0.98; Recall = 0.92; F1=0.95; Specificity = 0.95). BehaviorDEPOT freezing detection was comparable to highly trained human raters (N=4 videos, P=0.49, Mann-Whitney U).

