Figure 5.
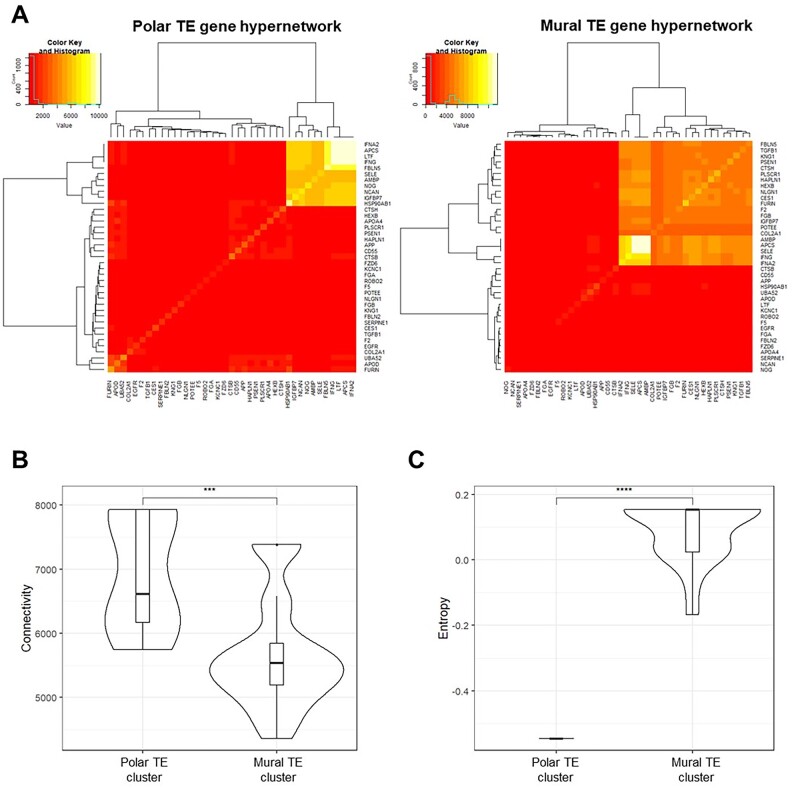
Polar and mural trophectoderm (TE) gene networks are differentially connected to endometrial epithelial cell (EEC) surface genes in an in silico model of the TE-EEC interface. (A) Hypernetwork analysis was performed on EEC-interacting TE genes (n = 39) in polar TE cells (n = 86) and mural TE cells (n = 245), and presented as a heatmap. Eleven genes form the highly connected central cluster in the polar TE hypernetwork and 21 genes form that in the mural TE hypernetwork. (B) Connectivity of hypernetwork clusters (the number of pairwise shared correlations) in polar and mural TE is presented as a violin plot. Median line and interquartile range are illustrated in each box, and whiskers illustrate the range with outliers as points. ***P < 0.001 Wilcoxon rank sum test. (C) Entropy from the hypernetwork clusters of polar and mural TE (a measure of the organization of gene connections), relative to entropy generated by permuting 1000 hypernetworks of random genes within the respective transcriptomes. Comparison of absolute entropy values between gene networks and subsets therein is not informative connectivity organization. Data are presented in violin plot form as above. ****P < 0.0001 Wilcoxon rank sum test.

