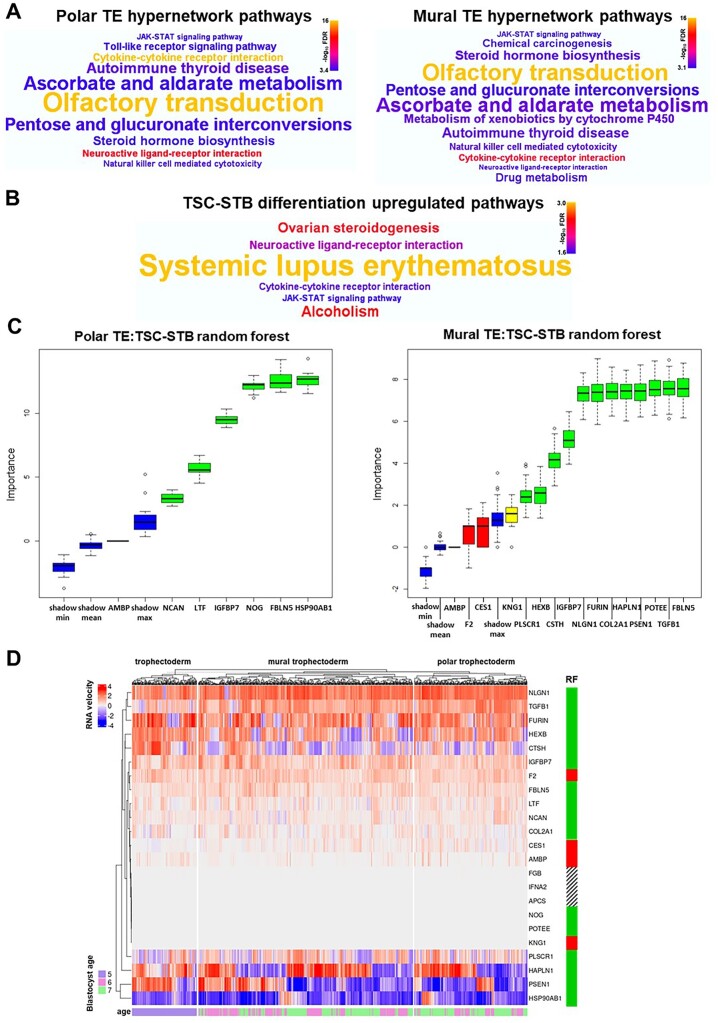
Figure 6.
Endometrial epithelial cell (EEC)-interacting trophectoderm (TE) gene networks are coupled to syncytiotrophoblast (STB) differentiation pathways. (A) Word clouds representing highly enriched (FDR < 0.001) KEGG pathways from over-representation analysis of genes connected within the polar and mural TE hypernetwork clusters, respectively. Word size reflects enrichment ratio, colour relates to significance level. Full list of significantly enriched pathways (FDR < 0.05) in Supplementary Tables SI and SII, respectively. (B) Word cloud representing the six most upregulated (FDR < 0.026) KEGG pathways from gene set enrichment analysis of genes differentially expressed upon trophoblast stem cell (TSC) differentiation to STB (P < 0.01, TSC n = 4, STB n = 4; Okae et al., 2018). Word size relates to enrichment ratio, colour to significance level. Full list of significantly enriched pathways (FDR < 0.05) in Supplementary Table SIII. (C) Boruta plots of random forest machine learning (1000 iterations) showing STB classification importance (TSC n = 4, STB n = 4; Okae et al., 2018) of hypernetwork-clustered EEC-interacting polar and mural TE genes expressed in TSC/STB (n = 7 and n = 16, respectively). Box-whisker plots represent importance Z-scores, a metric of informativity of a variable for classification. Green confirms statistical significance in the classification of STB, red indicates a non-informative gene in the classification of STB, yellow indicates a failure to either confirm or reject a gene as informative within the allotted number of random forest runs, and blue demonstrates the background variation of predictive value within the data. (D) RNA velocity was measured for each distinct hypernetwork-clustered EEC-interacting TE gene (n = 23, IFNG and SELE velocity data not available) in each cell of Day 5 TE (polar and mural distinction not available) and Day 6 and 7 polar and mural TE (Petropoulos et al., 2016). These velocity values were clustered within TE cell types in a heatmap, with blastocyst age in days indicated for each TE cell and random forest (RF) classification also indicated for each gene (green, variable of importance in the classification of STB; red, non-informative variable in the classification of STB; barred, importance not determined due to lack of expression in TSC/STB). FDR, false discovery rate.

