. 2022 Aug 4;11:e79736. doi: 10.7554/eLife.79736

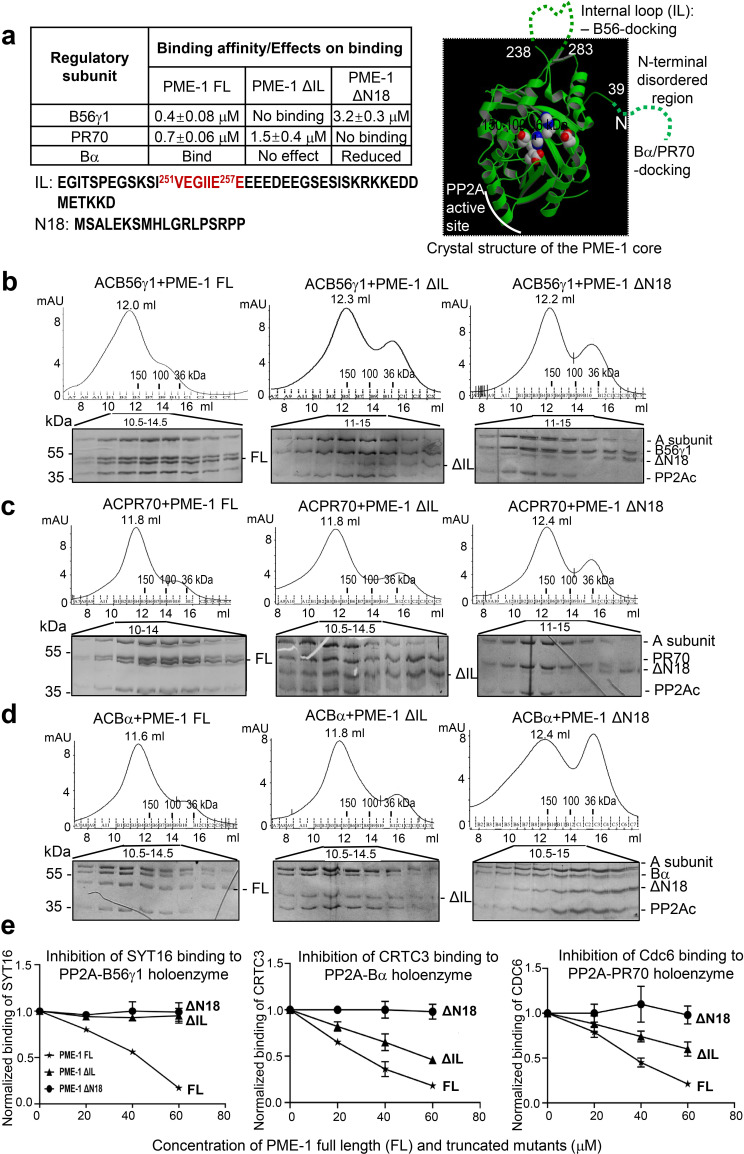
Figure 2. Mapping of PP2A methylesterase 1 (PME-1) interactions with protein phosphatase 2A (PP2A) regulatory subunits and holoenzymes.

(a) Summary of mapping results (Figure 2—figure supplement 1) on the roles of PME-1 disordered regions in interactions with different PP2A regulatory subunits (left) and illustration of disordered regions (dashed lines) and their contributions on the crystal structure of the apo-PME-1 structured core (PDB code: 3C5V) (right). Sequences of PME-1 internal loop (IL) and N-terminal 18 residues (N18) were shown, highlighting a substrate-mimicking B56 short linear motif (SLiM) in IL (lower left). The boundary residue numbers for the disordered regions are labeled, and the PME-1 active site residues are highlighted in spheres (right). Comigration of PP2A-B56γ1 (b), PP2A-PR70 (c), or PP2A-Bα (d) holoenzymes with PME-1 FL, ΔIL, or ΔN18 over gel filtration chromatography. Protein fractions with the indicated ranges of elution volumes were analyzed by sodium dodecyl sulfate–polyacrylamide gel electrophoresis (SDS–PAGE) and visualized by Coomassie blue staining. The molecular weight standards for gel filtration chromatography are generated as in Figure 1b. (e) PME-1 concentration-dependent inhibition of substrate peptide binding to specific holoenzymes. Inhibition curves against GST-SYT16 (132KLPHVLSSIAEEEHH147L) binding to PP2A-B56γ1 (left), GST-CRTC3 (380SGPSRRRQPPVSPLTLSPGPE401A) binding to PP2A-Bα (middle), and GST-Cdc6 (49KALPLSPRKRLG DDNLCNTPHLPPCSPPKQGK KENGPPHSH90T) to PP2A-PR70 (right) by PME-1 FL, ΔN18, or ΔIL were generated from competitive pulldown data in Figure 2—figure supplement 3a. Values for all data points on the inhibition curves are mean ± standard deviation (SD) from three experimental repeats.

Figure 2—source data 1. Source data for Figure 2b.
Figure 2—source data 2. Source data for Figure 2c.
Figure 2—source data 3. Source data for Figure 2d.
Figure 2—source data 4. Source data for Figure 2e.

Figure 2.

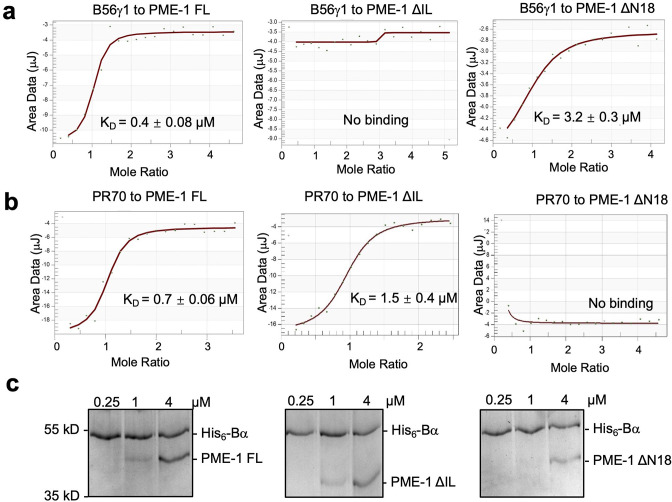
Figure 2—figure supplement 1. PP2A methylesterase 1 (PME-1) interactions with Bα and PR70 regulatory subunits and holoenzymes.

Figure 2—figure supplement 1.

(a) Isothermal titration calorimetry (ITC) measured the binding affinities of B56γ1 to PME-1 FL, ΔIL, or ΔN18. (b) ITC measured the binding affinities of PR70 to PME-1 FL, ΔIL, or ΔN18. (c) Pulldown of PME-1 FL, ΔIL, or ΔN18 by His6-tagged Bα immobilized on Ni-NTA resin. The interaction was reduced by the truncation of N terminal 18 residues of PME-1.
Figure 2—figure supplement 1—source data 1. Source data for Figure 2—figure supplement 1c.
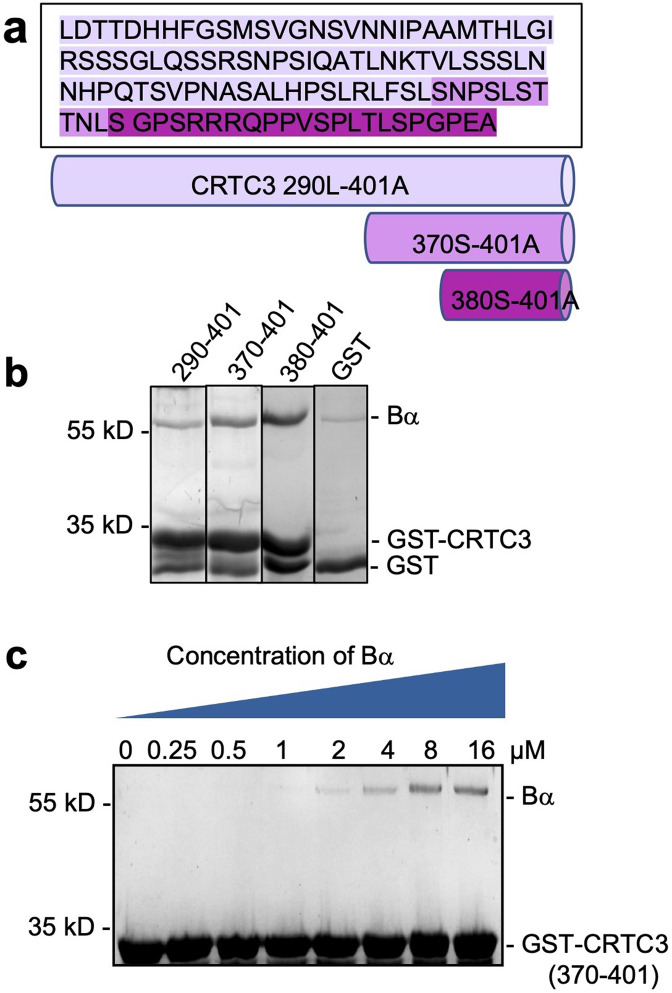
Figure 2—figure supplement 2. Mapping and characterization of CRTC3 peptide motif that interacts with Bα regulatory subunit.

Figure 2—figure supplement 2.

(a) Amino acid sequence of CRTC3 290–401 and illustration of truncated fragments. (b) Pulldown of Bα by GST-tagged CRTC3 fragments. GST was used as control. The shortest fragment, GST-CRTC3 380–401, gives the best binding. (c) Pulldown of titrated concentrations of Bα by GST-tagged CRTC3 370–401 assessed the binding affinity between CRTC3 and Bα to be around 3 μM.
Figure 2—figure supplement 2—source data 1. Source data for Figure 2—figure supplement 2b.
Figure 2—figure supplement 2—source data 2. Source data for Figure 2—figure supplement 2c.
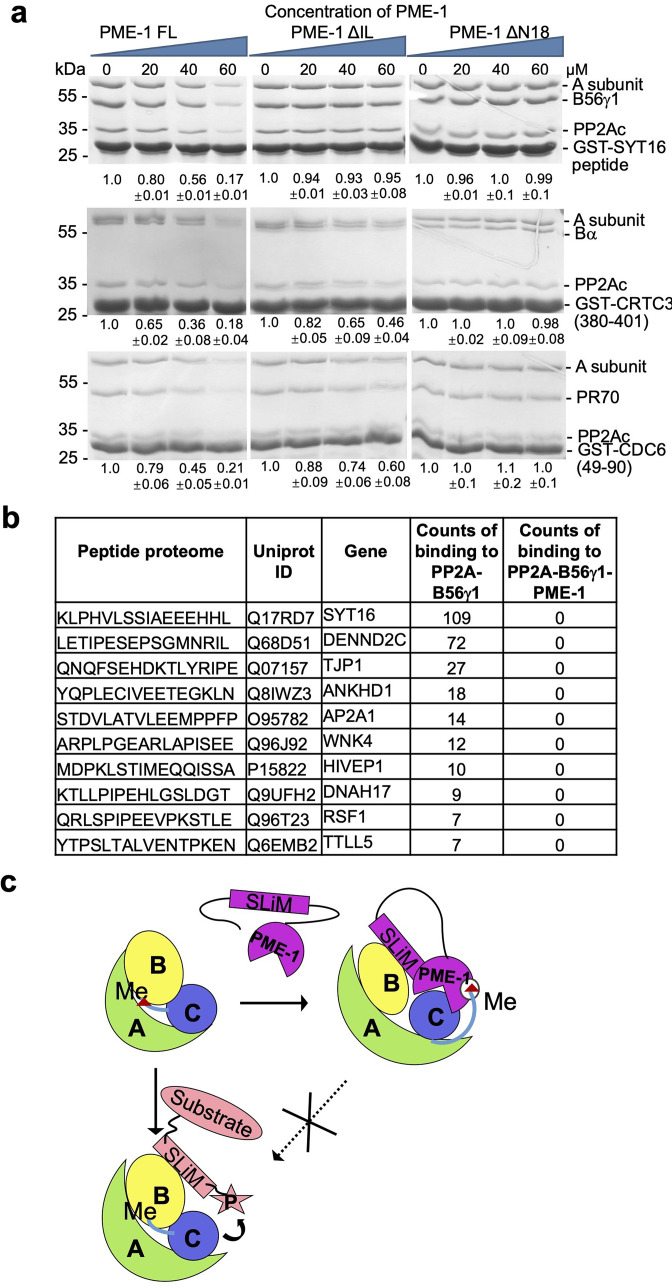
Figure 2—figure supplement 3. PP2A methylesterase 1 (PME-1) inhibits substrate binding to protein phosphatase 2A (PP2A) holoenzymes.

Figure 2—figure supplement 3.

(a) Pulldown of PP2A-B6γ1 (top), PP2A-Bα (middle), and PP2A-PR70 (bottom) holoenzymes via GST-tagged substrate peptides (GST-SYT16, GST-CRTC3, and GST-Cdc6) in the present and absence of increasing concentrations of PME-1 FL, ΔN18, or ΔIL. Proteins associated with Glutathione-Sepharose 4B (GS4B) resins were examined by sodium dodecyl sulfate–polyacrylamide gel electrophoresis (SDS–PAGE) and visualized by Coomassie blue staining. The intensity of the regulatory subunits in the bound holoenzyme was normalized to the GST-tagged substrate peptide, followed by normalization to the value in the absence of PME-1. Mean ± standard deviation (SD) were calculated from three independent experiments. Quantification using the scaffold A-subunit in the bound holoenzyme gave similar results. (b) Frequency of disordered motifs bound to the PP2A-B56γ1 holoenzyme in the presence and absence of PME-1 identified by peptide phage display of disordered human proteome. (c) A model illustrating how the substrate-mimicking short linear motif (SLiM) in PME-1 engages in holoenzyme interactions and blocks substrate recognition.
Figure 2—figure supplement 3—source data 1. Source data for Figure 2—figure supplement 3a.