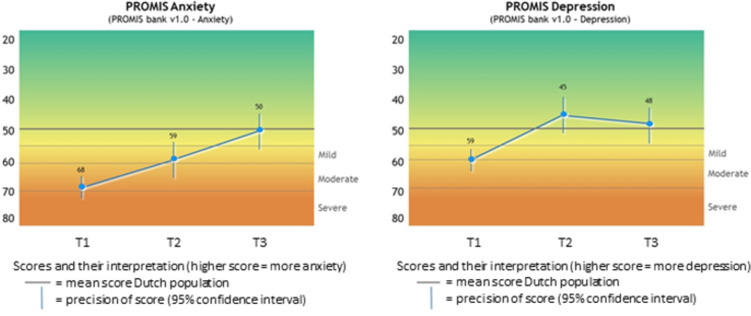
Fig 2. Visual feedback [59] of PROMIS Anxiety and Depression scores, based on Dutch mean T-scores and Dutch thresholds for mild, moderate and severe symptoms.
The blue lines represent imaginary data showing the course of symptoms over three consecutive assessments (T1, T2 and T3).

