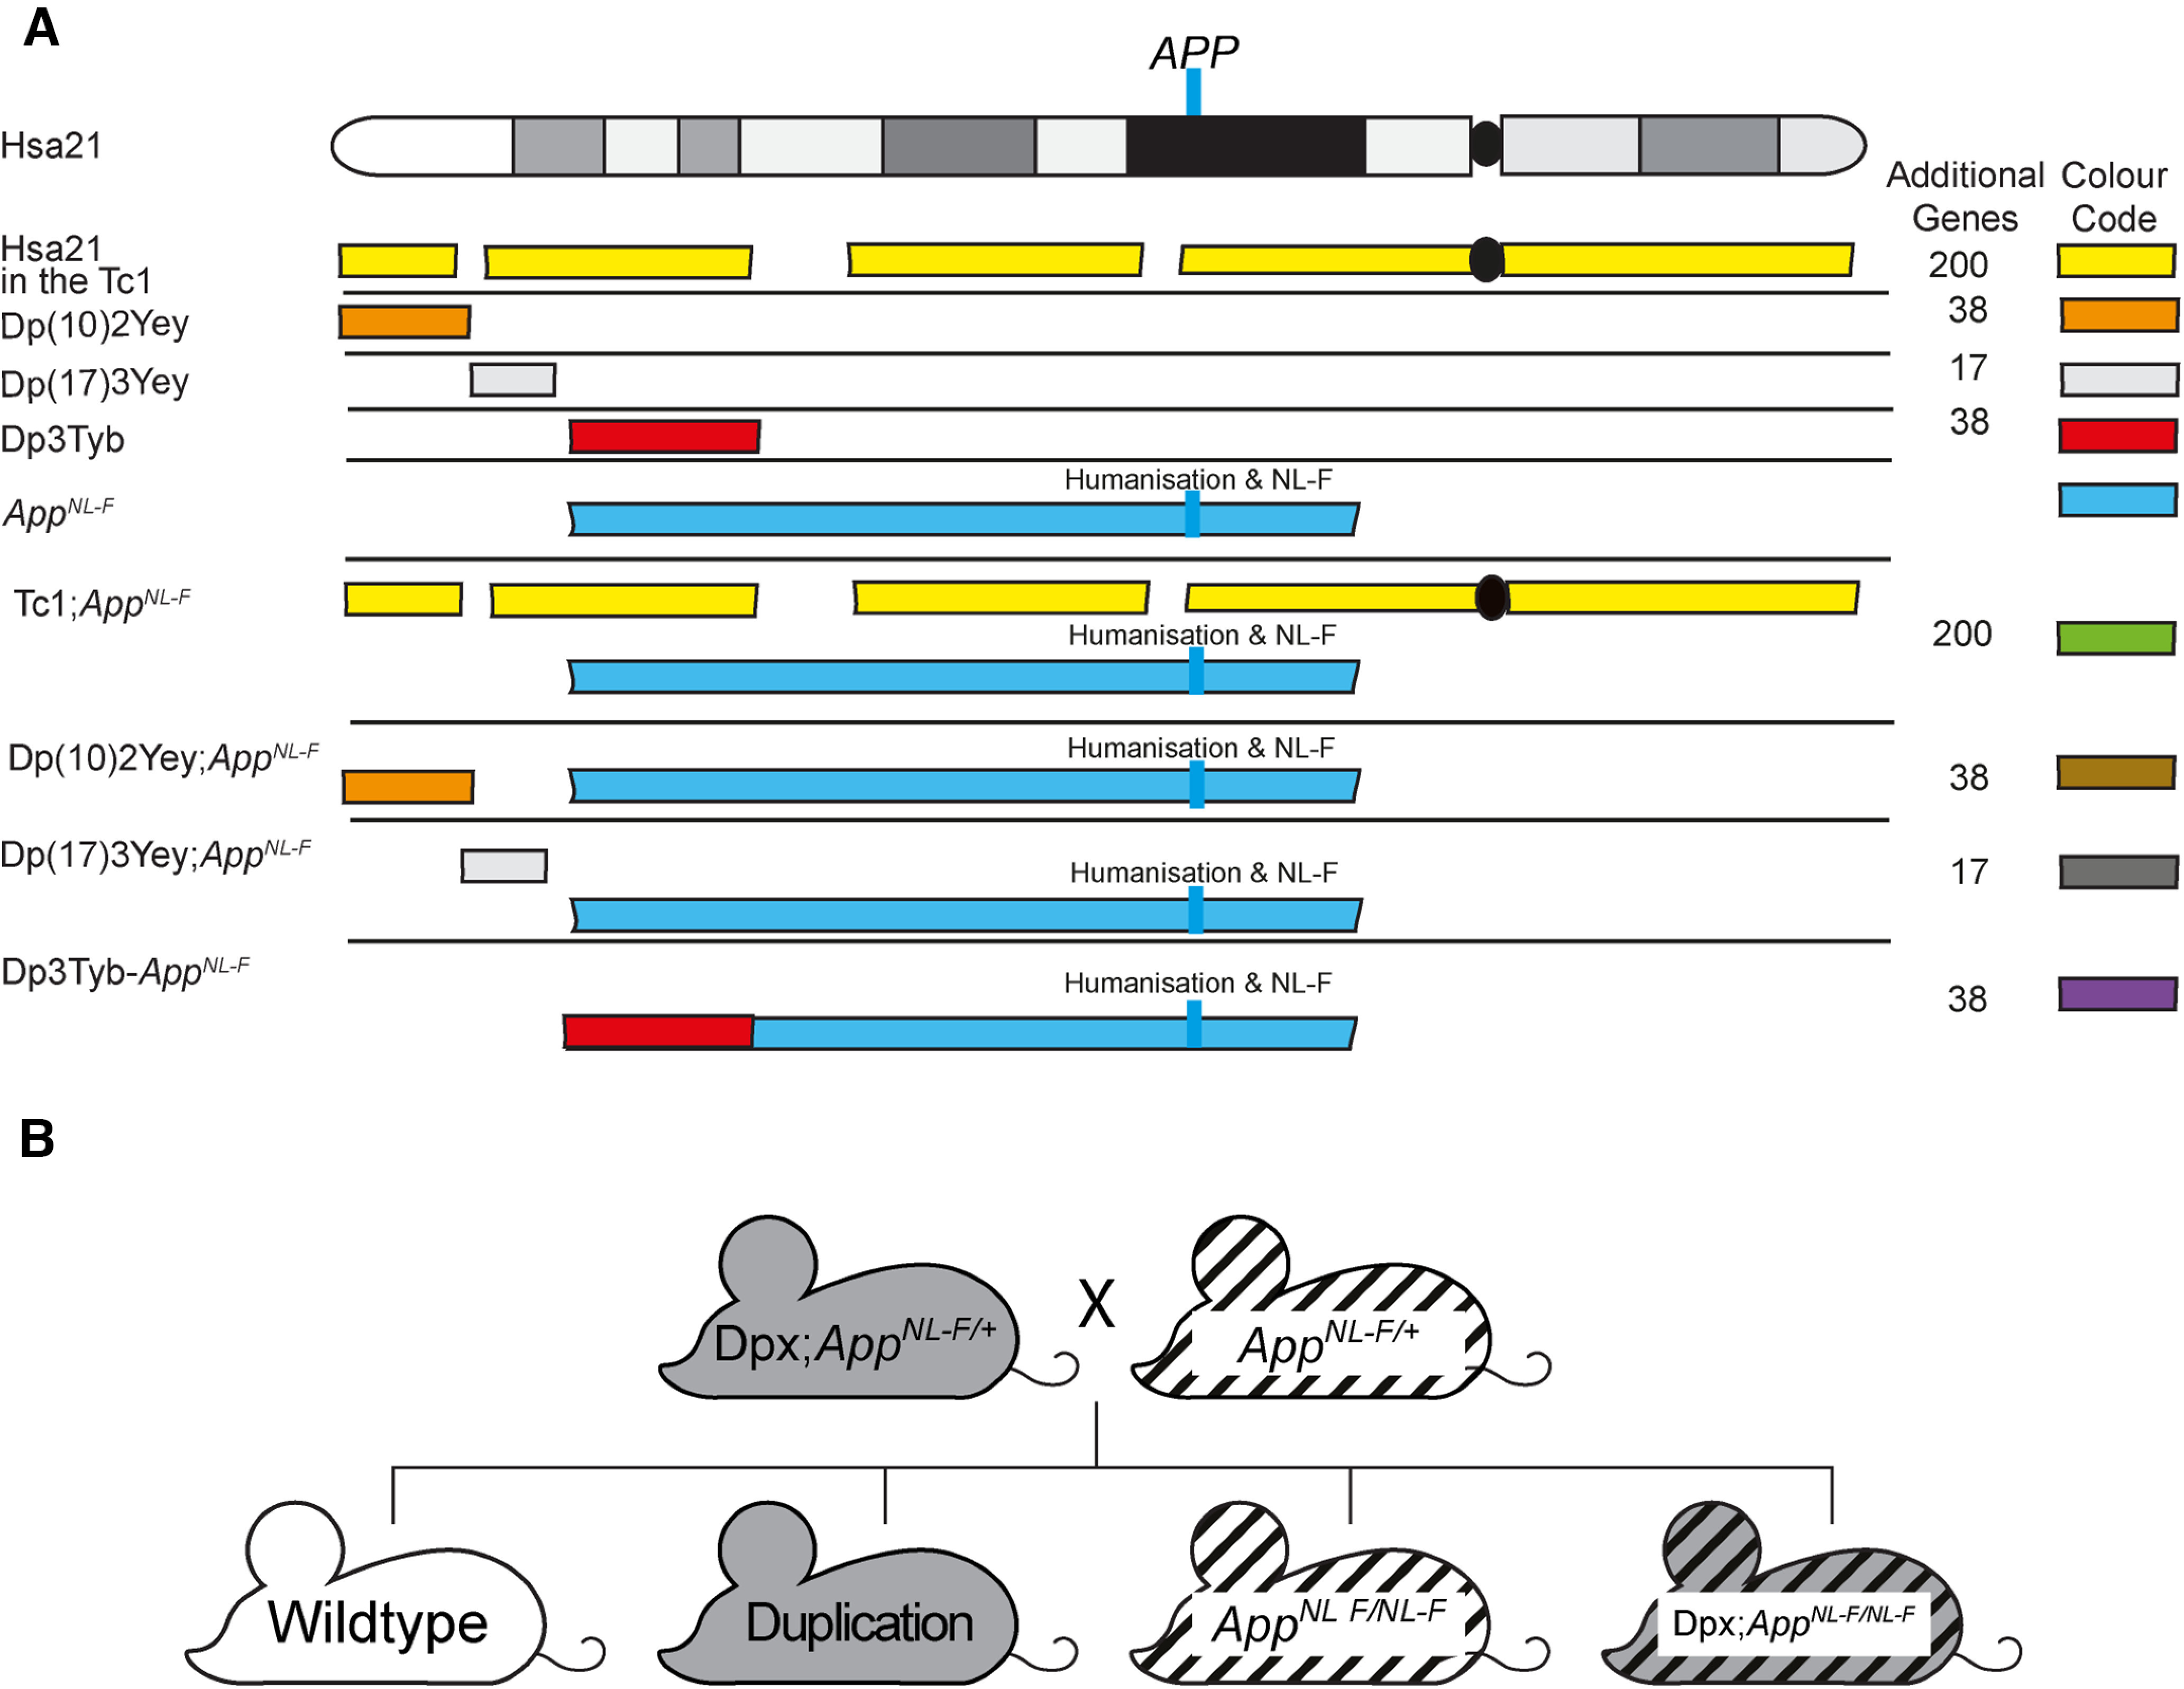
Figure 1.

A schematic of Hsa21 indicating the major karyotypic bands, and the regions of Hsa21 or homologous regions of mouse chromosomes that are in three copies in the mouse models used. A, The additional Hsa21 gene content in Tc1 (yellow), in the Dp(10)2Yey (orange), Dp(17)3Yey (light gray), and Dp3Tyb (red) segmental duplication models of DS as shown. The number of additional human genes in the Tc1, and the additional number of mouse genes in the Dp(10)2Yey, Dp(17)3Yey, and Dp3Tyb as listed. These lines were crossed with the AppNL-F mouse model of Aβ accumulation (blue), to generate Tc1;AppNL-F(green), Dp(10)2Yey;AppNL-F (brown), Dp(17)3Yey;AppNL-F(dark gray), and Dp3Tyb-AppNL-F (purple) offspring, homozygous for the AppNL-F allele and carrying the additional gene content. Blue line indicates the location of APP/App. This locus is altered in the AppNL-F model such that the Aβ sequence is humanized and the model carries the AD-causal Swedish (NL) and Iberian (F) mutations. This color scheme is used in subsequent figures to code for each of the mouse models. B, Schematic of the generation of experimental cohorts for the duplication models (Dp(10)2Yey, Dp(17)3Yey, and Dp3Tyb) used in the studies. Experimental cohorts were produced by crossing Dpx;AppNL-F/+ mice with AppNL-F/+ mice.
