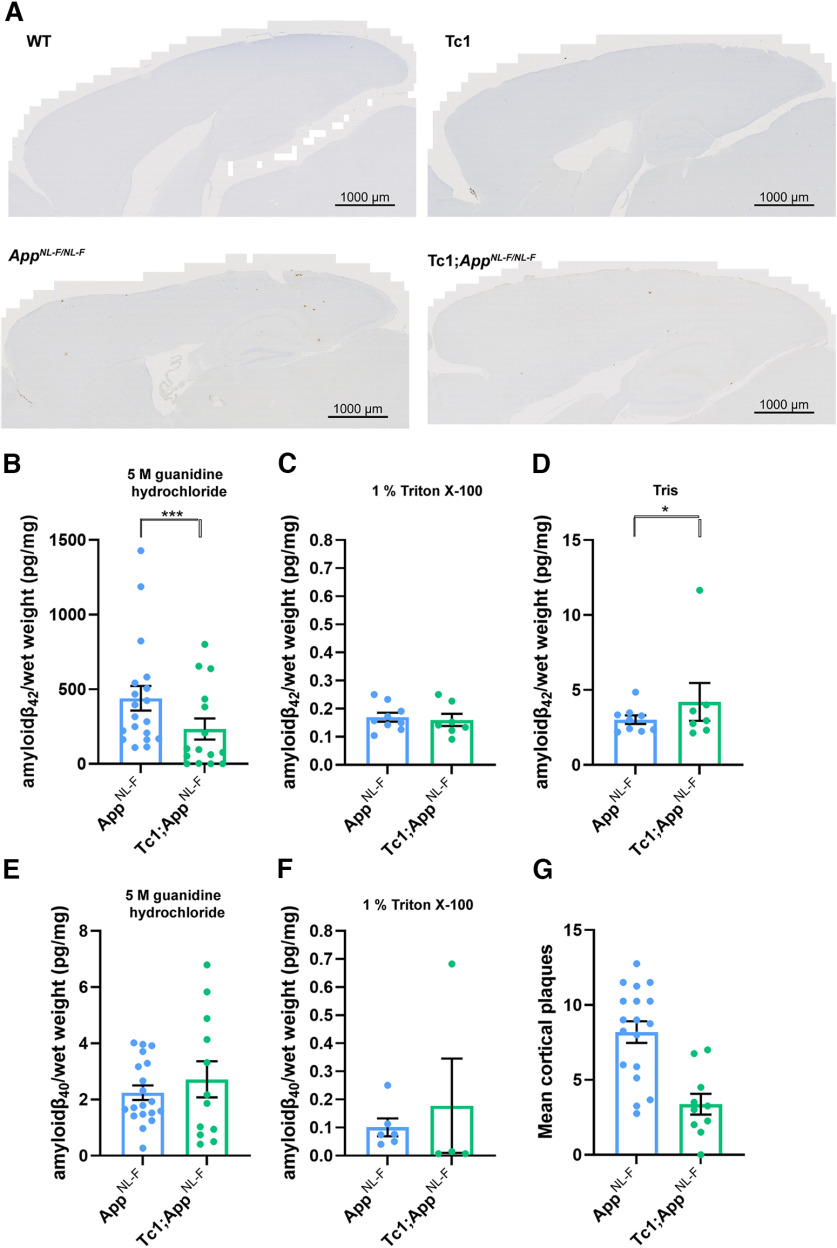
Figure 2.
Trisomy of Hsa21 results in a decrease in Aβ deposition in the AppNL-F/NL-F model. A, G, Aβ deposition (82E1) in the cortex was quantified at 8 months of age in male and female mice by manual plaque counting. A, Representative image of 82E1-stained Aβ deposits (brown) in WT, Tc1, AppNL-F/NL-F, and Tc1;AppNL-F/NL-F mice. G, Significantly fewer Aβ deposits in the cortex were observed in Tc1;AppNL-F/NL-F compared with AppNL-F/NL-F controls (F(1,23) = 24.997, p < 0.001). AppNL-F/NL-F female n = 11, male n = 7, Tc1; AppNL-F/NL-F female n = 4, male n = 6. No Aβ deposits were observed in WT (female n = 5) or Tc1 (female n = 5, male n = 3) age-matched littermate controls (data not shown). B–F, Total cortical proteins were biochemically fractionated and amyloid abundance analyzed by MSD assay. B, No statistically significant difference in the abundance of 5 m guanidine hydrochloride-soluble Aβ42 was observed between Tc1;AppNL-F/NL-F compared with AppNL-F/NL-F controls (F(1,13) = 2.262, p = 0.156). AppNL-F/NL-F female n = 15, male n = 8; Tc1;AppNL-F/NL-F female n = 8, male n = 10. WT and Tc1 samples that do not produce human Aβ were included as negative controls. WT n = 4, of which 1 was below limit of detection (mean = 0.543 pg/mg, SEM = 0.433); Tc1 n = 6, of which 4 samples were below the limit of detection (mean = 2.175 pg/mg, SEM 1.437). C, No difference in the abundance of 1% Triton X-100-soluble Aβ42 was observed between Tc1;AppNL-F/NL-F compared with AppNL-F/NL-F controls (F(1,5) = 0.015, p = 0.907). AppNL-F/NL-F female n = 7, male n = 2 (n = 8 below limit of detection); Tc1;AppNL-F/NL-F female n = 5, male n = 2 (n = 11 below limit of detection). WT and Tc1 samples that do not produce human Aβ were included as negative controls. WT n = 4, of which 2 were below the limit of detection (mean = 0.021 pg/mg, SEM = 0.007); Tc1 n = 6, of which all samples were below the limit of detection. D, Significantly more Tris-soluble Aβ42 was observed in Tc1; AppNL-F/NL-F compared with AppNL-F/NL-F controls (F(1,5) = 10.697, p = 0.022). AppNL-F/NL-F female n = 7, male n = 2 (n = 8 below limit of detection) Tc1;AppNL-F/NL-F female n = 5, male n = 2 (n = 11 below limit of detection). WT and Tc1 samples that do not produce human Aβ were included as negative controls. WT n = 4, of which all were below the limit of detection; Tc1 n = 6, of which all samples were below the limit of detection. E, No difference in the abundance of 5 m guanidine hydrochloride-soluble Aβ40 was observed between Tc1;AppNL-F/NL-F compared with AppNL-F/NL-F controls (F(1,13) = 0.005, p = 0.946). AppNL-F/NL-F female n = 11, male n = 8, n = 4 below the limit of detection; Tc1;AppNL-F/NL-F female n = 7, male n = 5, n = 6 below the limit of detection. WT and Tc1 samples that do not produce human Aβ were included as negative controls. WT n = 4, of which 3 were below the limit of detection (1.870 pg/mg); Tc1 n = 6, of which 5 samples were below the limit of detection (1.150 pg/mg). F, No difference in the abundance of 1% Triton X-100-soluble Aβ40 was observed between Tc1;AppNL-F/NL-F compared with AppNL-F/NL-F control (F(1,3) = 0.000, p = 0.991). AppNL-F/NL-F female n = 4, male n = 0 (n = 17 below the limit of detection); Tc1;AppNL-F/NL-F female n = 4, male n = 2 (n = 14 below the limit of detection). Tris-soluble Aβ40 was not detected in these samples. WT and Tc1 samples that do not produce human Aβ were included as negative controls (Table 2). WT n = 4, of which 2 samples were below limit of detection (mean = 0.090 pg/mg, SEM = 0.005); Tc1 n = 6, of which all samples were below the limit of detection. Error bars indicate SEM, *p < 0.05 and ***p < 0.001. Data points represent independent mice.

