
Figure 2.
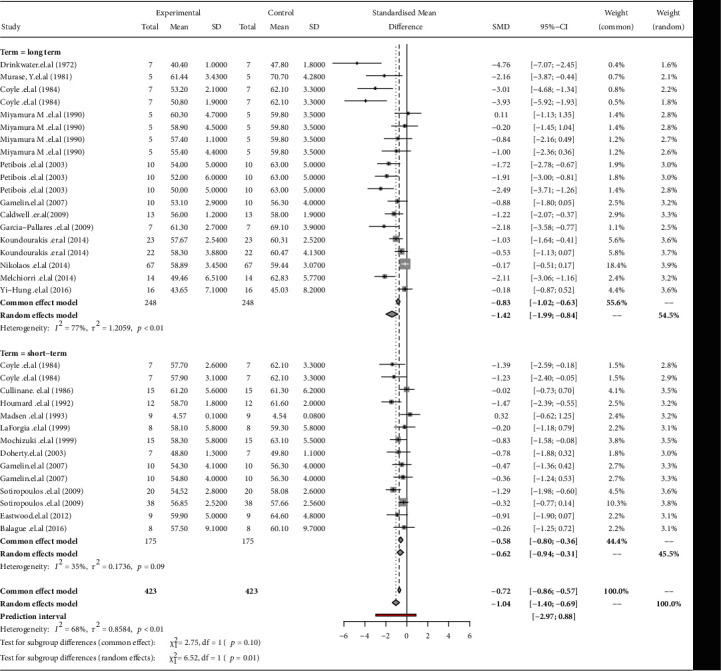
A forest plot of changes in V̇O2max for long-term and short-term training cessation. Mean and SD were reported on the plot and experimental group and control group means after detraining and before detraining, respectively. SMD: 95% confidence intervals (CI) and each study weight are shown on the right side. Gray boxes: each study's effect size, and gray diamonds: subgroup overall.