Figure 1.

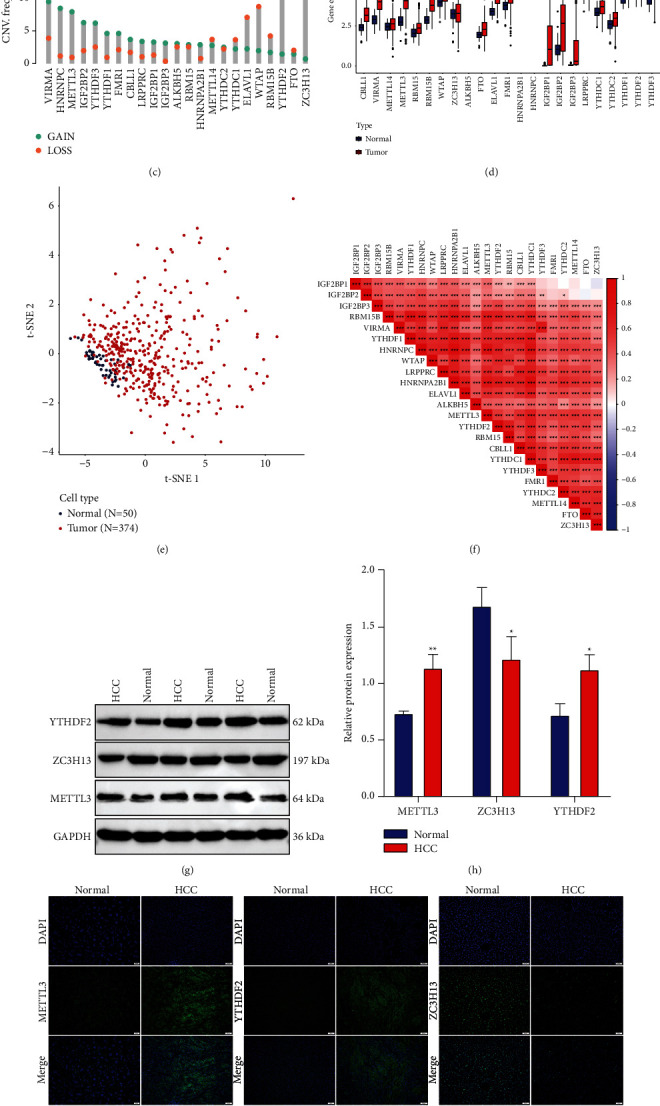
Overall mutations and expression of m6A regulatory genes across HCC: (a) the locations of CNV alterations of 23 m6A modifiers on human chromosome. (b) The frequency of somatic mutations of 23 m6A modifiers across HCC specimens from TCGA cohort. The number on the right denoted the variation frequencies of modifies and the right bars displayed the proportions of mutation types. Each column represented individual samples. The stacked bars below indicated the fractions of transformation across specimens. (c) The CNV frequencies of m6A modifiers across HCC specimens from TCGA cohort. The column height indicated the mutation frequencies. Blue represented the frequency of gain and orange represented the frequency of loss. (d) The differences in mRNA levels of 23 m6A modifiers between HCC and normal tissues in TCGA cohort. (e) The t-SNE for distinguishing HCC (red dot) from control (blue dot) specimens based on the regulators. (f) Pearson analyses for the mutual regulation among regulators at the mRNA expression. The darker the red, the stronger the correlation. (g, h) Western blot of the expression of three regulators METTL3, ZC3H13, YTHDF2 in 3 paired HCC and normal tissues. (i, j) Immunofluorescence for the levels of above regulators. Bar = 50 μm. Ns: no significance; ∗p < 005; ∗∗p < 0.01; ∗∗∗p < 0.001; ∗∗∗∗p < 0.0001.
