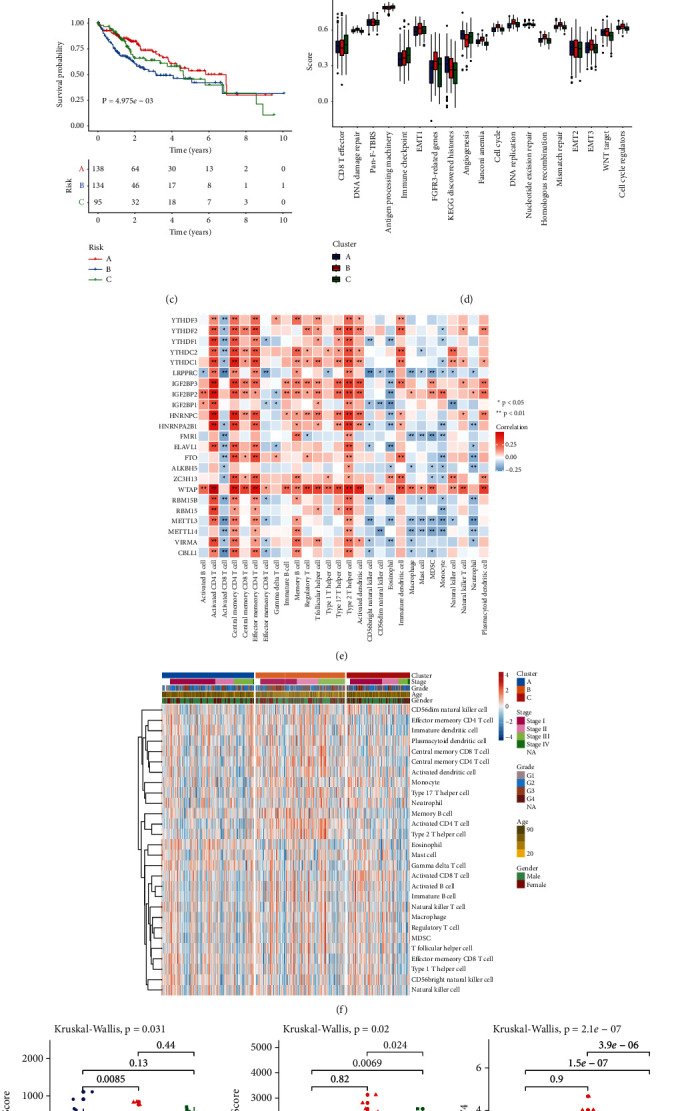
Figure 3.

Characterization of m6A methylation patterns with diverse prognosis and TME landscape in TCGA cohort: (a) Heatmaps for the mRNA levels of 23 m6A modifiers among three m6A machinery phenotypes. (b) Heatmap of the GSVA scores of Hallmark pathways in distinct m6A modification patterns. (c) Kaplan–Meier OS curves for HCC patients from TCGA data set with diverse patterns (log-rank tests). (d) The differences in the activation of several pathways among three patterns. Kruskal-Wallis H test was applied for comparing three clusters. Ns: no significance; ∗p < 0.05; ∗∗p < 0.01; ∗∗∗p < 0.001. (e) Heatmap of the correlations of 23 m6A modifiers with infiltrating immune cells based on ssGSEA method. Positive correlation, red; negative correlation, blue. (f) Heatmap for the differences in 28 immune population abundance among three patterns. (g) The discrepancy in stromal/immune score and CD274 expression among three patterns.
