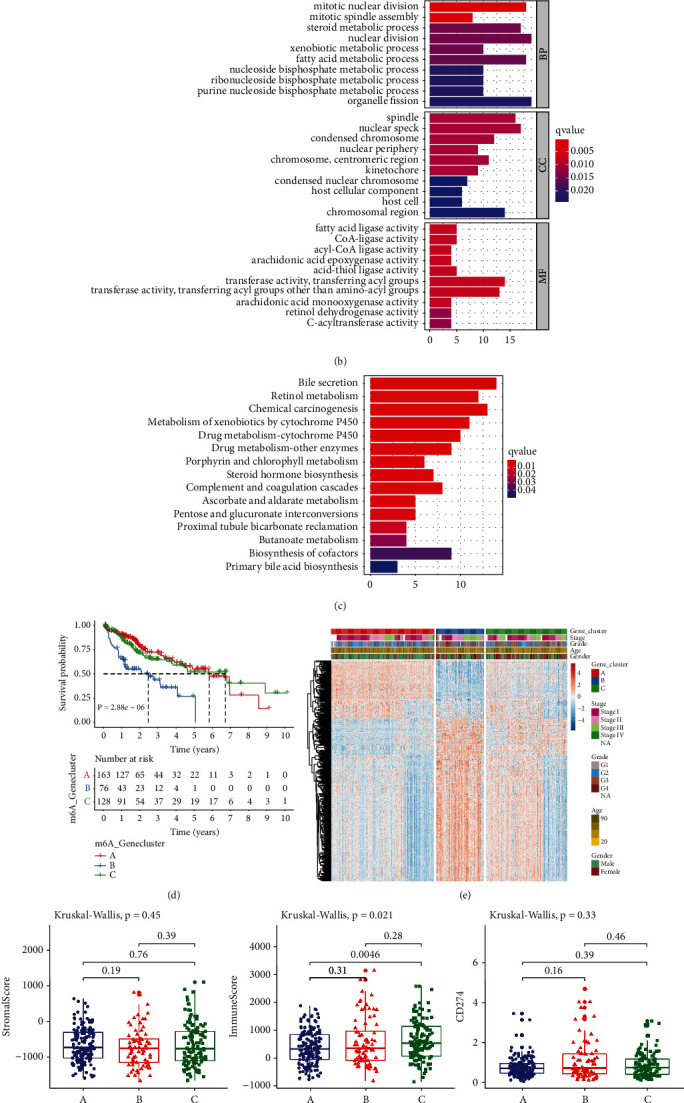
Figure 4.

Construction of m6A genomic phenotypes in HCC from TCGA cohort: (a) Venn diagram for the 331 m6A phenotype-associated DEGs between three genomic phenotypes. (b) GO and (c) KEGG enrichment results of the m6A phenotype-associated DEGs. (d) Kaplan–Meier curves of OS for three gene clusters (log-rank tests). (e) Heatmap for the levels of the m6A phenotype-associated DEGs among clusters. (f) The discrepancy in stromal score, immune score and CD274 expression among clusters.
