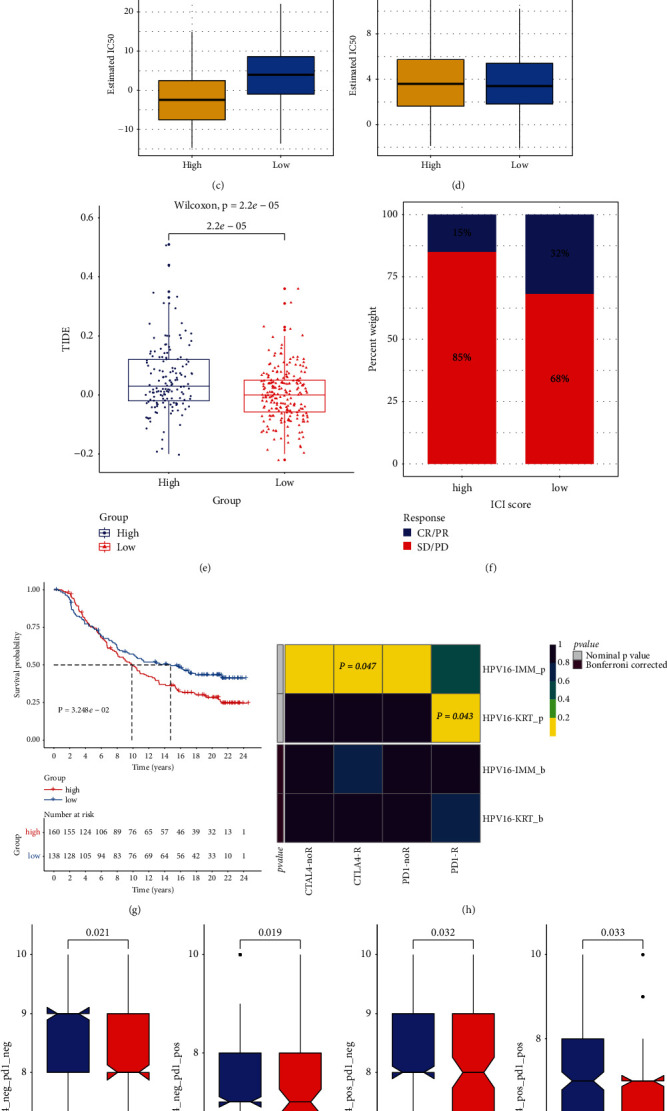
Figure 6.

The roles of m6A score in prediction of chemo- and immunotherapeutic benefits of HCC patients in TCGA cohort: (a, b) Somatic mutation landscape of significantly mutated genes across (a) high or (b) low m6A score populations. (c, d) The differences in estimated IC50 values between populations. (e) The comparisons in TIDE score between populations. P values were determined with Wilcoxon tests. (f) The proportions of subjects responding to anti-PD-L1therapy in two populations in the IMvigor210 cohort. (g) Kaplan–Meier OS curves for cases with high and low m6A scores (log-rank test). (h) The response of cases with high and low m6A scores to anti-CTLA-4/PD-1 therapies through SubMap analyses. (i) The comparisons of IPS scores in two populations.
