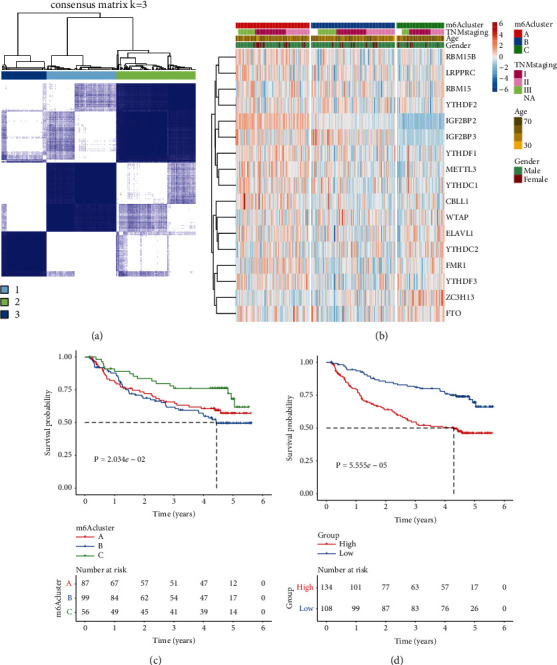
Figure 7.

Verification of the m6A methylation patterns and m6A score for HCC in the GSE14520 data set: (a) Consensus clustering analysis for classifying 242 HCC patients into three m6A machinery phenotypes in the light of the expression profiles of 23 m6A modifiers. (b) Heatmap for the expression of 23 m6A regulators among three patterns. (c) Kaplan–Meier OS curves among three phenotypes. (d) Kaplan-Meier OS curves for cases with high or low m6A score. P values were calculated with log-rank tests.
