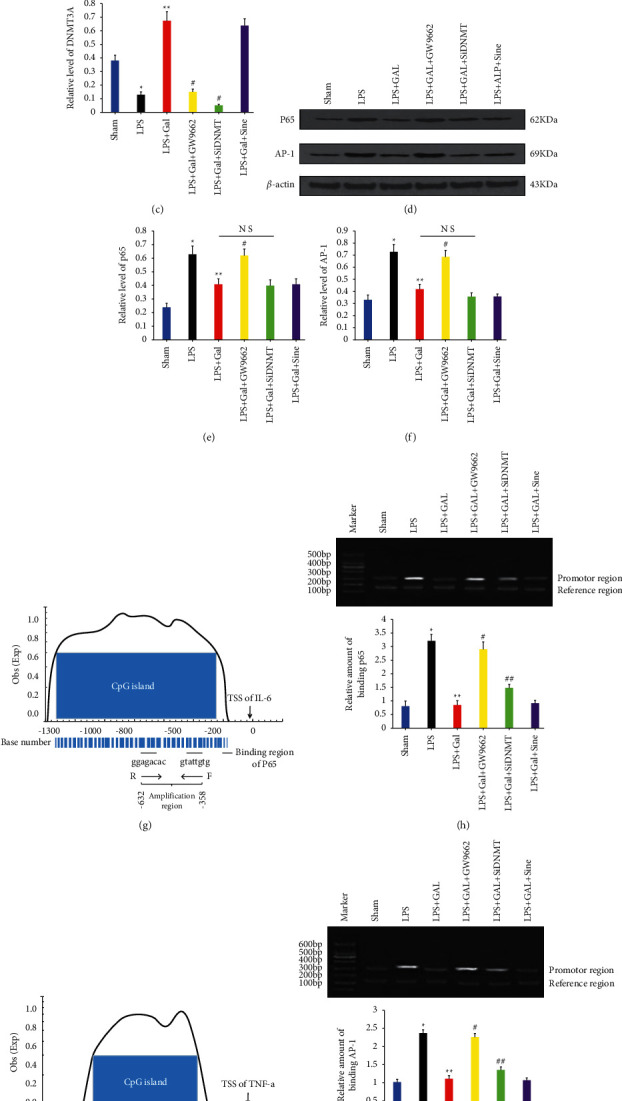
Figure 1.

PPAR/DNMT3A pathway mediates the inhibition of inflammatory molecule synthesis by galangin in rat monocytes. (a) The WB assay results of PPAR and DNMT3A contents in BALF monocyte nuclei for various groups. (b, c) The relative levels of PPAR and DNMT3A expression, respectively. (d) The WB assay results of p65 and AP-1 levels in BALF monocyte nuclei. (e) The relative levels of p65 and AP-1 expression. In all the abovementioned analyses, β-actin is used as the internal control. (g, i) The blue parts present the CpG islands located in the promoter regions of rat IL-6 and TNF-a, respectively. There are binding sites for corresponding TFs within the aforementioned CpG islands, and the Chip-qPCR amplification regions are also located in these islands. (h) The Chip-qPCR results of phosphorylated p65 bound to the CpG island in the IL-6 promoter, where the relative density of bands in the upper gel electrophoresis map represents the semiquantitative PCR result. As is clear, the size of the amplification region at the IL-6 promoter site is 275 bp, and the reference sequence is the second intron region of IL-6, which has a size of 158 bp. Meanwhile, the bar graph describes the relative binding capacity of p65 that was analyzed by AlphaEase FC version 4. (j) The Chip-qPCR results shows AP-1 binding to the CpG island in the TNF-a promoter, where the amplification region has a size of 338 bp. The bar graph describes the relative binding capacity of AP-1, and the reference sequence is the same as that used in the IL-6 assay. ∗P < 0.05 versus Sham group; ∗∗P < 0.05 versus LPS group; #P < 0.05 versus LPS + GAL group; ##P < 0.05 versus LPS + GAL and LPS + GAL + GW9662 groups.
