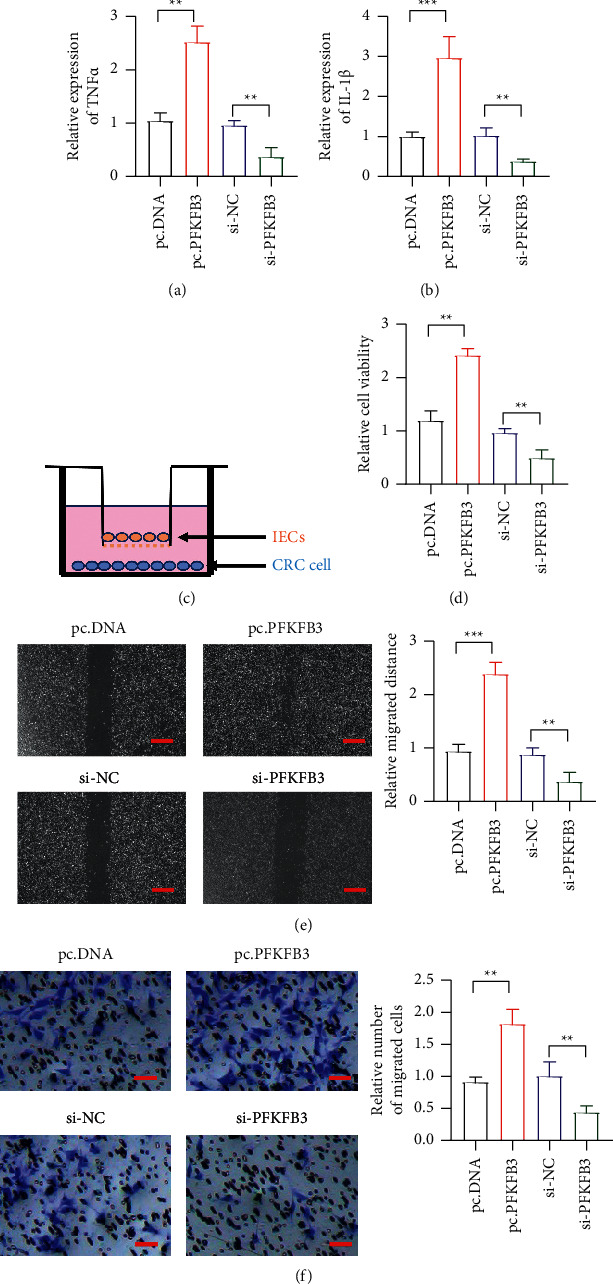
Figure 2.

The role of PFKFB3 in CAC. (a)-(b) The expression of IL-1β and TNF-α level detected in PFKFB3 overexpression and knockdown. (c) The coculture assay detecting the influence of IECs on CRC cell. (d) The proliferation of CRC by PFKFB3 overexpression and knockdown in IECs. (e) The migration of CRC by PFKFB3 overexpression and knockdown in IECs; scar bar = 100 μm. (f) The invasion of CRC by PFKFB3 overexpression and knockdown in IECs; scar bar = 50 μm. ∗∗P < 0.01, ∗∗∗p < 0.001. pcDNA, empty vector; Si-NC, siRNA negative control.
