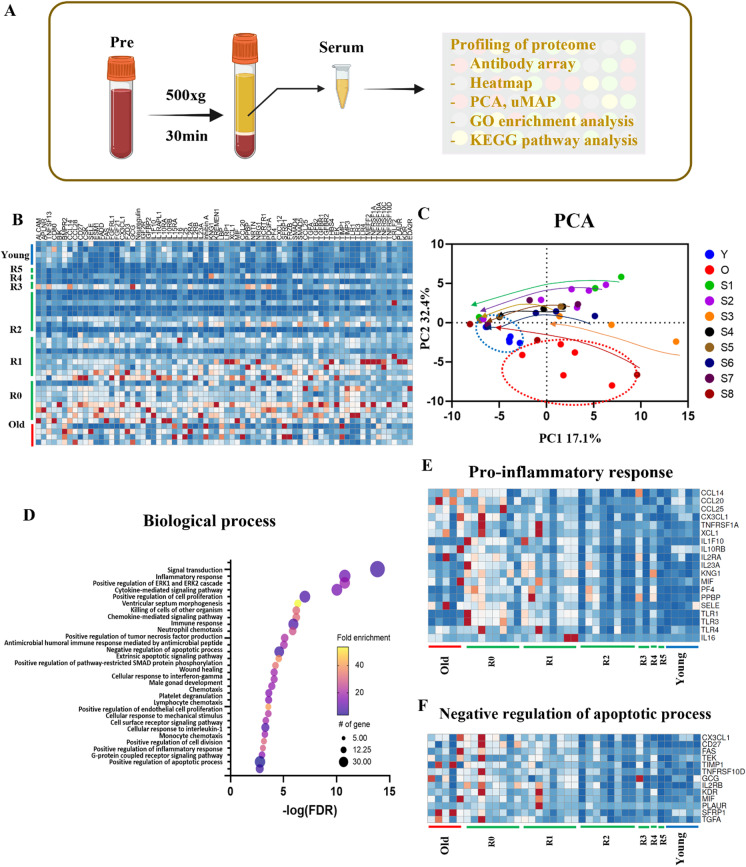
Fig. 2.
Proteomic profiling of TPE serum using antibody array. A Schematic of the study. B Heat mapping of the 72 proteins that are significantly different (> 1.75 fold change) between the young and the old cohorts. C Principal component analysis (PCA) of the antibody array data of the young, old, and TPE groups for all rounds. Young, N = 5; old, N = 5; TPE, N = 8 (e.g., 8 patients in each TPE round). Arrow tails are R0, and heads are the last round for each group. D The top 30 Gene Ontology terms of biological processes. E The heat map of inflammatory response protein levels (p = 4.10E − 14). F The heat map of apoptosis protein levels (p = 3.60E − 07). Most proteins in the three different terms were close to old before TPE treatment and became close to the young group over monthly rounds of TPE

