Fig. 5.
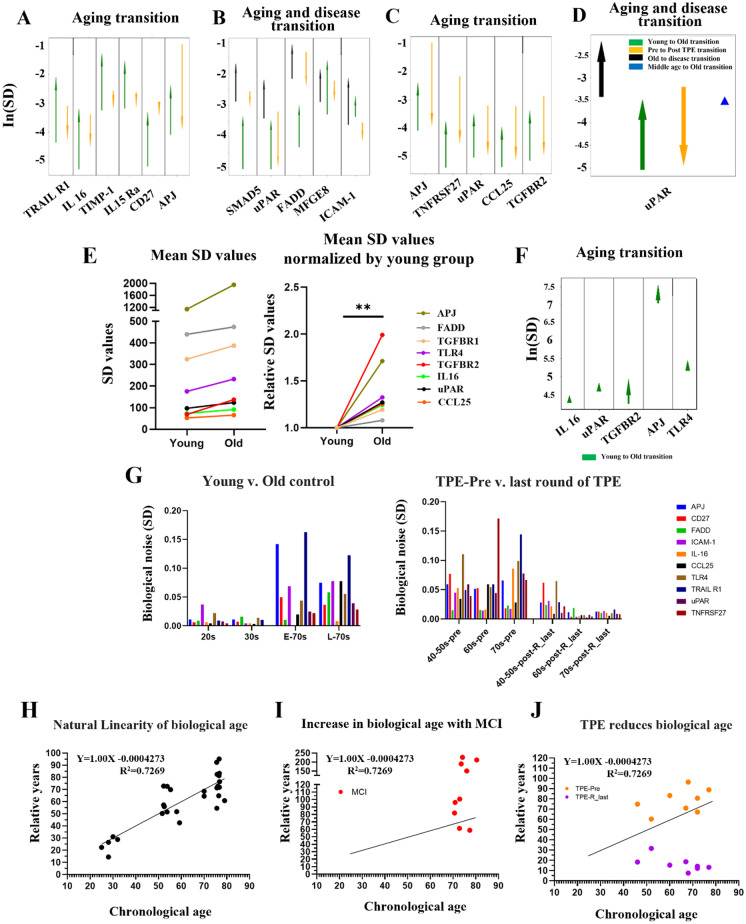
Profiling changes in biological noise using standard deviation (SD) among young, old, TPE, and disease cohorts. A The change in the SD of the 507 proteins (antibody array proteomics) between young and old people and between people before TPE and people after TPE, in proteins which had a Benjamini–Hochberg procedure false discovery rate of 10% regarding the significance of variance changes with age. B The change in SD between young and old people, between people with a neurodegenerative disorder and healthy people of the same age, and between people before and after TPE, in proteins which have significantly different variances in the aging and disease comparisons. C The change in SD between young and old people and between people before TPE and people after TPE, in proteins which had significantly different variances between age groups and which had their SD change by a factor of 5 or greater with TPE treatment. D The change in SD between young and old people, between people with a neurodegenerative disorder and healthy people of the same age, between people before TPE and people after TPE, and between middle-aged and old people, in proteins which have significantly different variances in the aging and disease comparisons and which had their SD change by a factor of 5 or greater with TPE treatment. In each case, significance was determined with the mean based Levene’s test. E Comparison of mean SDs of the mRNA levels of 8 genes between young and old groups, for each SD value of each gene (left), expressed as a fold increase of young (right, **p = 0.003). F The change in SD of the 5 genes between young and old people, in proteins which had a Benjamini–Hochberg procedure (see “Materials and methods”) false discovery rate of 10% regarding the significance of variance changes with age. G The biological noise was calculated using the SD of 10 selected proteins, divided by age. The biological noise of 10 proteins increases in the old group, compared with the young group. Interestingly, there is a clear and significant decrease of protein noise levels after rounds of TPE for all noise-detectors. H Plot of biological age calculated as the SD of the uncovered noise detectors versus chronological age. I The distribution of MCI, based on the 10 noise biomarkers. J Biological age shifts after repeated TPE treatment. Compared to before TPE treatment, all patients show a decrease in biological age in the last round of TPE, demonstrating significant rejuvenation by TPE

