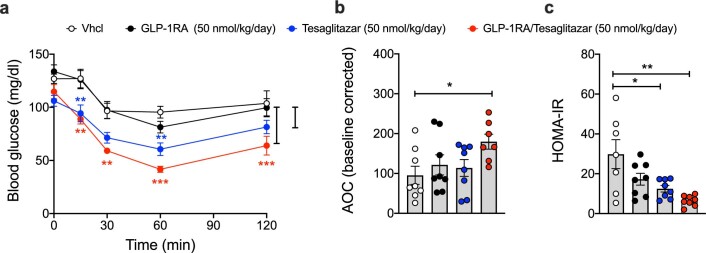
Extended Data Fig. 3. Insulin sensitivity in DIO mice after treatment with GLP-1/Tesaglitazar.
Intraperitoneal insulin tolerance (ITT) (a), baseline-corrected area of curve (AOC) (b) and HOMA-IR (c) of male 34-wk old DIO mice treated for 14-days with Vhcl or 50 nmol/kg of either GLP-1RA, Tesaglitazar or GLP-1RA/Tesaglitazar. Sample sizes are n = 8/8/8/7 mice (a,b) and n = 7/8/8/8 mice (c). Data in (a) were analyzed by 2-way ANOVA with Bonferroni post-hoc comparison for individual time points. Data in (b,c) were analyzed by 1-way ANOVA with Bonferroni multiple comparison test. Data represent means ± SEM; asterisks indicate * p < 0.05, ** p < 0.01, *** p < 0.001. Red asterisks indicate significance of GLP-1RA/Tesaglitazar over Vhcl, blue asterisks indicate significance of Tesaglitazar over Vhcl. Exact p-values for treatment effects are (a) p = 0.0016 and p < 0.0001; (b) p = 0.0424; (c) p = 0.0193 and p = 0.0010.

