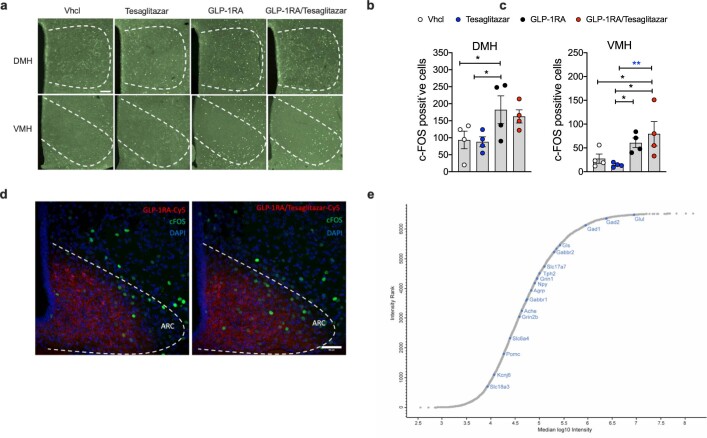
Extended Data Fig. 4. Acute drug effects on hypothalamic cFOS and neuronal marker.
Immunofluorescence (a) and quantification (b,c) of cFos positive neurons in the ventromedial hypothalamus (VMH) and dorsomedial hypothalamus (DMH) (n = 4 male 47-wk old C57BL/6 J mice each group, scale bar: 100 µm). Representative immunofluorescence image of Cyanine 5 (Cy5) labeled appearance of GLP-1RA and GLP-1RA/Tesaglitazar in the ARC of 49-wk old male C57BL/6 J DIO mice after 90 min of treatment with a single s.c. dose of 150 nmol/kg of either GLP-1RA-Cy5 or GLP-1RA/Tesaglitazar-Cy5 (n = 3/4 mice; scale bar: 50 µm) (d). Neuronal markers in the hypothalamic proteome (e). To illustrate the large dynamic range, quantified proteins across all hypothalamic samples were ranked and plotted according to their median Intensity. Marker proteins of different neuronal subtypes are highlighted in blue. Data in (b,c) were analyzed by 1-way ANOVA and Fisher’s LSD test. Data represent means ± SEM; asterisks indicate * p < 0.05, ** p < 0.01, *** p < 0.001. Exact p-values for treatment effects are (b) p = 0.0388 (Vhcl vs. GLP-1RA) and p = 0.0299 (Tesaglitazar vs. GLP-1RA); (c) p = 0.0269 (Vhcl vs. GLP-1RA/Tesaglitazar), p = 0.0446 (GLP-1RA vs. Tesaglitazar) and p = 0.0082 (GLP-1RA vs. GLP-1RA/Tesaglitazar).

