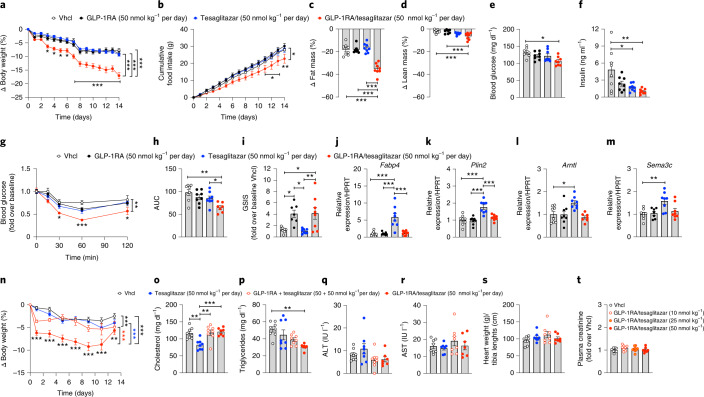
Fig. 2. Chronic high-dose effects of GLP-1RA/tesaglitazar in obese and lean mice.
a–d, Effects on body weight (a), cumulative food intake (b) and change of fat (c) and lean tissue mass (d) in 34-week-old male C57BL/6J DIO mice treated for 14 days with 50 nmol kg−1 per day. e,f, Fasting levels of blood glucose (e) and insulin (f) at study day 7. g,h, i.p. insulin tolerance (ipITT) assessed at day 14: blood glucose (g) and AUC (h). i, In vivo glucose-stimulated insulin secretion (GSIS) in 47-week-old male DIO mice treated i.p. with 1.5 g glucose per kg body weight (blood was collected at time points 0 and 15 min after glucose injection) (i). j–m, Expression of Fabp4 (j) and Plin2 (k) in liver and of Arntl (l) and Sema3c (m) in skeletal muscle of 30-week-old male DIO mice treated for 3 days with 50 nmol kg−1 per day. n–s, Changes in body weight (n), plasma levels of cholesterol (o), triglycerides (p), aspartate-aminotransferase (q), alanine-transferase (r) as well as heart weight (s) in 16-week-old male lean C57BL/6J mice after 14 days treatment with 50 nmol kg−1 per day. t, Plasma levels of creatinine in 44-week-old male C57BL/6J DIO mice treated for 14 days with vehicle (Vhcl) or GLP-1RA/tesaglitazar at a dose of 10, 25 or 50 nmol kg−1 per day (n = 8 mice each group). Sample sizes for treatment with Vhcl, GLP-1RA, tesaglitazar or GLP-1RA/tesaglitazar (a–m) are n = 8/8/8/8 mice (a,d,f,j,k), n = 8/7/8/8 mice (c,i,m), n = 7/8/8/8 mice (e) and n = 8/8/8/7 mice (g,h,l). Cumulative food intake (b) was assessed per cage in n = 4/4/4/4 cages containing n = 8/8/8/8 mice. Sample sizes for treatment with Vhcl, tesaglitazar, GLP-1RA + tesaglitazar or GLP-1RA/tesaglitazar (n–s) are n = 8/7/8/7 mice (n), n = 8/8/8/7 mice (o–q,s) and n = 8/8/7/7 mice (r). Data represent means ± s.e.m. Data in a, b, g and n have been analysed by two-way ANOVA with Bonferroni post hoc comparison for individual time points. Data in c–f, h–m and o–t have been analysed by one-way ANOVA using the Bonferroni’s multiple comparison test. Asterisks indicate *P < 0.05, **P < 0.01, ***P < 0.001. Exact P values for treatment effects are a all P ≤ 0.0001; b P = 0.043; c all P < 0.0001, d P = 0.0007 (versus Vhcl) and P = 0.0010 (versus GLP-1RA); e P = 0.0106; f P = 0.0216 and P = 0.0035; g P = 0.0064; h P = 0.0011 and P = 0.0359; i P = 0.024 (Vhcl versus GLP-1RA), P = 0.0143 (Vhcl versus GLP-1RA/tesaglitazar), P = 0.0125 (GLP-1RA versus GLP-1RA/tesaglitazar), P = 0.0072 (tesaglitazar versus GLP-1RA/tesaglitazar; j all P < 0.0001; k all P < 0.0001; l P = 0.0127; m P = 0.0032; n P = 0.0002 (GLP-1RA + tesaglitazar versus Vhcl), all other P < 0.0001; o P = 0.0012 (GLP-1RA + tesaglitazar versus Vhcl), P = 0.0008 (GLP-1RA/tesaglitazar versus tesaglitazar), P = 0.0020 (Vhcl versus tesaglitazar); p P = 0.0031. For exact P values at individual time points (a,b,g,n), see the data source file.

